- Age: 14-16 MYP Individuals and Societies
- Age: 14-16 GCSE / IGCSE Geography
- Natural Environments
- Economic Development
- IGCSE Geography Revision Question Bank
- 2.1 Earthquakes and volcanoes
- 2.4 Weather
- 2.5 Climate and natural vegetation
- Distribution
- Plate Tectonics
- Plate Boundaries | Plate Margins

Volcano case study - Mount Etna (2002-2003), Italy
- Volcano case study - Mount Nyiragongo, Democratic Republic of Congo
- Volcanic hazard management - Mount Rainier, USA
- Earthquakes
- Earthquake case study - 2005 Kashmir
- Earthquake case study - Chuetsu Offshore Earthquake - 2007
- Why was the Haitian Earthquake so deadly?
- Earthquakes - Managing the hazard
Can you describe the location of Mount Etna? Could you draw a sketch map to locate Mount Etna?

Case study task
Use the resources and links that can be found on this page to produce a detailed case study of the 2002-2003 eruption of Mount Etna. You should use the 'Five W's" subheadings to give your case study structure.
What happened?
The Guardian - Sicilian city blanketed in ash [28 October 2002]
When did it happen?
Immediately before midnight on 26 October 2002 (local time=GMT+1), a new flank eruption began on Mount Etna. The eruption ended after three months and two days, on 28 January 2003.
Where did it happen?
The eruption occurred from fissures on two sides of the volcano: at about 2750 m on the southern flank and at elevations between 2500 and 1850 m on the northeastern flank.

Why did it happen?
Mount Etna is a volcano. The reasons why Mount Etna is located where it is are complex. Here are some of the theories:
- One theory envisages a hot spot or mantle-plume origin for this volcano, like those that produce the volcanoes in Hawaii.
- Another theory involves the subduction of the African plate under the Eurasian plate.
- Another group of scientists believes that rifting along the eastern coast of Sicily allows the uprise of magma.
Who was affected by it happening?
- The Italian Government declared a state of emergency in parts of Sicily, after a series of earthquakes accompanying the eruption of forced about 1,000 people flee their homes.
- A ship equipped with a medical clinic aboard was positioned off Catania - to the south of the volcano - to be ready in case of emergency.
- Emergency workers dug channels in the earth in an attempt to divert the northern flow away from the town of Linguaglossa.
- Schools in the town have been shut down, although the church has remained open for people to pray.
- Villagers also continued their tradition of parading their patron saint through the streets to the railway station, to try to ward off the lava flow.
- Civil protection officials in Catania, Sicily's second-biggest city, which sits in the shadow of Etna, surveyed the mountain by helicopter and were ready to send water-carrying planes into the skies to fight the fires.
- The tourist complex and skiing areas of Piano Provenzana were nearly completely devastated by the lava flows that issued from the NE Rift vents on the first day of the eruption.
- Heavy tephra falls caused by the activity on the southern flank occurred mostly in areas to the south of the volcano and nearly paralyzed public life in Catania and nearby towns.
- For more than two weeks the International Airport of Catania, Fontanarossa, had to be closed due to ash on the runways.
- Strong seismicity and ground deformation accompanied the eruption; a particularly strong shock (magnitude 4.4) on 29 October destroyed and damaged numerous buildings on the lower southeastern flank, in the area of Santa Venerina.
- Lava flows from the southern flank vents seriously threatened the tourist facilities around the Rifugio Sapienza between 23 and 25 November, and a few days later destroyed a section of forest on the southwestern flank.
- The eruption brought a heightened awareness of volcanic and seismic hazards to the Sicilian public, especially because it occurred only one year and three months after the previous eruption that was strongly featured in the information media.
Look at this video clip from an eruption on Mount Etna in November 2007. What sort of eruption is it?
There is no commentary on the video - could you add your own explaining what is happening and why?
You should be able to use the knowledge and understanding you have gained about 2002-2003 eruption of Mount Etna to answer the following exam-style question:
In many parts of the world, the natural environment presents hazards to people. Choose an example of one of the following: a volcanic eruption, an earthquake, or a drought. For a named area, describe the causes of the example which you have chosen and its impacts on the people living there. [7 marks]
- Comment on Twitter


An official website of the United States government
Here's how you know
Official websites use .gov A .gov website belongs to an official government organization in the United States.
Secure .gov websites use HTTPS A lock ( ) or https:// means you’ve safely connected to the .gov website. Share sensitive information only on official, secure websites.

- Digg
Latest Earthquakes | Chat Share Social Media
The 2018 eruption of Kīlauea: Insights, puzzles, and opportunities for volcano science
The science of volcanology advances disproportionately during exceptionally large or well-observed eruptions. The 2018 eruption of Kīlauea Volcano (Hawai‘i) was its most impactful in centuries, involving an outpouring of more than one cubic kilometer of basalt, a magnitude 7 flank earthquake, and the volcano’s largest summit collapse since at least the nineteenth century. Eruptive activity was documented in detail, yielding new insights into large caldera-rift eruptions; the geometry of a shallow magma storage-transport system and its interaction with rift zone tectonics; mechanisms of basaltic tephra-producing explosions; caldera collapse mechanics; and the dynamics of fissure eruptions and high-volume lava flows. Insights are broadly applicable to a range of volcanic systems and should reduce risk from future eruptions. Multidisciplinary collaboration will be required to fully leverage the diversity of monitoring data to address many of the most important outstanding questions.
Citation Information
| Publication Year | 2023 |
|---|---|
| Title | The 2018 eruption of Kīlauea: Insights, puzzles, and opportunities for volcano science |
| DOI | |
| Authors | Kyle R. Anderson, Tom Shea, Kendra J. Lynn, Emily Montgomery-Brown, Donald A. Swanson, Matthew R. Patrick, Brian Shiro, Christina A. Neal |
| Publication Type | Article |
| Publication Subtype | Journal Article |
| Series Title | Annual Review of Earth and Planetary Sciences |
| Index ID | |
| Record Source | |
| USGS Organization | Geologic Hazards Science Center; Volcano Science Center |
Related Content
Kyle r. anderson, ph.d., volcano geophysicist, kendra j. lynn, ph.d., volcanologist - petrologist, emily montgomery-brown, research geophysicist, volcano geodesist, matthew patrick, ph.d., research geologist, brian shiro, ph.d., deputy director, christina a. neal, science center director.
Thank you for visiting nature.com. You are using a browser version with limited support for CSS. To obtain the best experience, we recommend you use a more up to date browser (or turn off compatibility mode in Internet Explorer). In the meantime, to ensure continued support, we are displaying the site without styles and JavaScript.
- View all journals
- Explore content
- About the journal
- Publish with us
- Sign up for alerts
- Open access
- Published: 15 July 2022
Responding to eruptive transitions during the 2020–2021 eruption of La Soufrière volcano, St. Vincent
- E. P. Joseph ORCID: orcid.org/0000-0002-4836-8715 1 ,
- M. Camejo-Harry ORCID: orcid.org/0000-0001-5979-7497 1 , 2 ,
- T. Christopher 1 , 3 ,
- R. Contreras-Arratia ORCID: orcid.org/0000-0003-2713-5397 1 ,
- S. Edwards ORCID: orcid.org/0000-0001-7536-4480 1 ,
- O. Graham ORCID: orcid.org/0000-0002-9468-927X 1 ,
- M. Johnson 1 ,
- A. Juman 1 ,
- J. L. Latchman 1 ,
- L. Lynch 1 ,
- V. L. Miller ORCID: orcid.org/0000-0003-1962-9223 1 , 3 ,
- I. Papadopoulos ORCID: orcid.org/0000-0003-2923-3070 1 ,
- K. Pascal 1 , 3 ,
- R. Robertson ORCID: orcid.org/0000-0001-5245-2787 1 ,
- G. A. Ryan ORCID: orcid.org/0000-0002-9469-0107 1 , 3 ,
- A. Stinton 1 , 3 ,
- R. Grandin 4 ,
- I. Hamling ORCID: orcid.org/0000-0003-4324-274X 5 ,
- M-J. Jo 6 ,
- J. Barclay ORCID: orcid.org/0000-0002-6122-197X 7 ,
- P. Cole ORCID: orcid.org/0000-0002-2964-311X 8 ,
- B. V. Davies ORCID: orcid.org/0000-0001-5771-2488 7 &
- R. S. J. Sparks 9
Nature Communications volume 13 , Article number: 4129 ( 2022 ) Cite this article
6256 Accesses
30 Citations
30 Altmetric
Metrics details
- Environmental impact
- Natural hazards
- Volcanology
A critical challenge during volcanic emergencies is responding to rapid changes in eruptive behaviour. Actionable advice, essential in times of rising uncertainty, demands the rapid synthesis and communication of multiple datasets with prognoses. The 2020–2021 eruption of La Soufrière volcano exemplifies these challenges: a series of explosions from 9–22 April 2021 was preceded by three months of effusive activity, which commenced with a remarkably low level of detected unrest. Here we show how the development of an evolving conceptual model, and the expression of uncertainties via both elicitation and scenarios associated with this model, were key to anticipating this transition. This not only required input from multiple monitoring datasets but contextualisation via state-of-the-art hazard assessments, and evidence-based knowledge of critical decision-making timescales and community needs. In addition, we share strategies employed as a consequence of constraints on recognising and responding to eruptive transitions in a resource-constrained setting, which may guide similarly challenged volcano observatories worldwide.
A new method to compile global multi-hazard event sets
Volcanic activity and hazard in the East African Rift Zone
A process-based approach to understanding and managing triggered seismicity
Introduction.
A major goal of volcanology is to forecast changes in the behaviour of volcanoes, particularly the onset and conclusion of eruptions and behavioural transitions, such as between explosive and effusive activity 1 , 2 , 3 . Transitions pose challenges for decision-makers in the management of ongoing volcanic crises; >75% of recent fatalities are associated with changing eruptive behaviour, where all or some individuals were inside declared hazard zones at that point 4 . The 2020–2021 La Soufrière volcanic eruption in St. Vincent, illustrates these challenges.
Crisis science is defined as conducting scientific research during a crisis, which involves data acquisition, analysis, interpretation and archiving of scientific and technical resources, as well as organising logistics, staffing and communicating findings with stakeholders and the public 5 . Volcanic crises include unrest, eruption and any aftermath. The core goal of observatory staff during crises is to acquire, analyse interpret and communicate data in a way that assists local populations and civil protection agencies with their decision-making 6 .
La Soufrière volcano (13.33°N; 61.18°W), located in northern St. Vincent, is a 1220 m high stratovolcano with a summit crater ~1.6 km in diameter and 300–600 m deep 7 . Historical eruptions of basaltic-andesitic magmas typically last many months 8 , 9 and occur in both the absence and presence of a crater lake. Eruptions have been both explosive (1718 7 , 1812, 1902–03, 1979) and effusive (1784, 1971–72). The most recent 1979 eruption ended with a 120 m × 860 m lava dome emplaced in the crater. As in many volcanoes worldwide, fatalities are associated with rapid accelerations in explosive activity 4 exemplified by the 1812 and 1902–03 St. Vincent eruptions.
Precursory unrest was markedly low-level prior to the 1971–1972 and 1979 eruptions, which began with <24 h of instrumentally recorded precursory seismicity 9 . Since the 1800s, several episodes of unrest without eruption (crater lake temperature changes, felt seismicity) have also occurred.
Increased background seismicity at La Soufrière from 1 November into December 2020 prompted an inspection of the crater by staff of the Soufrière Monitoring Unit (SMU), of St. Vincent and the Grenadines (SVG) National Emergency Management Organisation (NEMO), on 16 November 2020. Minor changes in fumarolic activity on the dome and the small lake occupying the eastern crater floor were noted. Seismicity reduced after 23 December 2020.
Surface activity was first recognised on 27 December 2020, when the NASA Fire Information for Resource Management System (FIRMS) detected a thermal anomaly inside the summit crater. On 29 December 2020, thermal anomalies and greyish-white emissions were observed. SMU staff discovered a new dome located in the west south-west sector of the crater, adjacent to the 1979 dome. Effusive activity continued for three months, with a rapid increase in effusion rate in early April 2021 leading to the explosive phase between 9 and 22 April. Thereafter, activity was limited to moderate SO 2 outgassing and generally low-level seismicity.
Here we describe monitoring data and the evolution of scientific interpretations. We also reflect on the information most critical to the generation of actionable forecasts of eruptive transition in a ‘real world’ setting.
Results and discussion
Network strengthening.
Overall emergency management and scientific support for La Soufrière volcano were coordinated by the staff of The University of the West Indies Seismic Research Centre (UWI SRC) in Trinidad, with assistance from the Montserrat Volcano Observatory (MVO) as well as regional and international collaborating partners. Initial observations and local support were provided by the SMU.
Limited resources and the COVID pandemic resulted in a much-reduced monitoring capacity at the onset of unrest (November 2020), with one working seismic station (SVB) 9 km from the volcano, and one continuous GPS station (SVGB) (Fig. 1 ). SRC reactivated the local observatory in late December 2020 and upgraded the monitoring network (Fig. 1 ). Eight broadband seismic stations were operating by the end of February 2021 and the ground deformation network was augmented by four continuous GPS sites (SVGR, SVGS, SVGF, SVGG) in addition to re-occupation of two campaign benchmark sites (JCWL and TBRK) (Fig. 1 ). A 9-prism EDM target was installed on the southern crater rim and weekly measurements attempted from six locations. Interferometric Synthetic Aperture Radar (InSAR) processing of available ALOS-2 and Sentinel-1 images augmented ground deformation monitoring. Sentinel-2 and PlanetLabs satellite imaged both the crater and colour changes of vegetation on the volcano’s flanks. Cameras installed at the Belmont Observatory (3 January 2021) and crater rim (24 January 2021), multispectral and radar satellite imagery, oblique aerial and terrestrial photographs and UAV aerial photography and photogrammetry allowed visual observations to document dome growth. From 14 January 2021, gas emissions were measured using a Multi-component Gas Analysing System (MultiGAS) and Ultra-Violet (UV) spectroscopy.
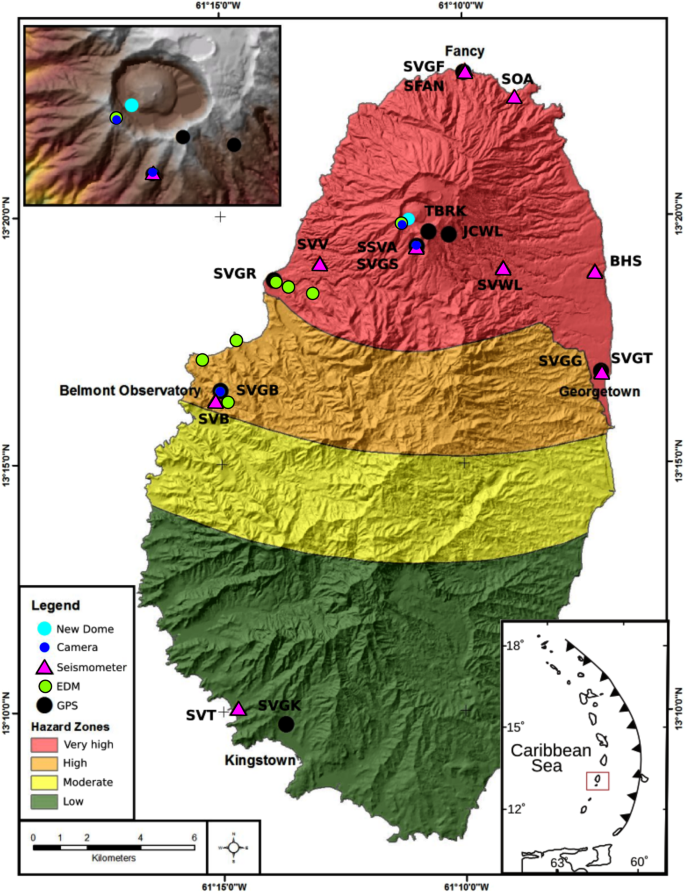
Hazard zones illustrate the potential for ground-based volcanic impacts such as pyroclastic flows and surges, tephra fall, ash fall and lahars that may impact the defined areas 7 . The boundaries of the zones are based on the past incidence of the hazards and areas of maximum projected extent, in addition, experience of these hazards at similar volcanoes is combined with theoretical considerations of mass discharge rates of magma, wind direction and morphology. The effects of effusive eruptions have had little impact on the determination of hazard zones.
Seismic monitoring
Seismicity increased slightly on station SVB in November 2020, but remained modest until 23 December 2020, averaging two events per day, with a maximum magnitude of 3.3 Mt and no reported felt events (Fig. 2 ).
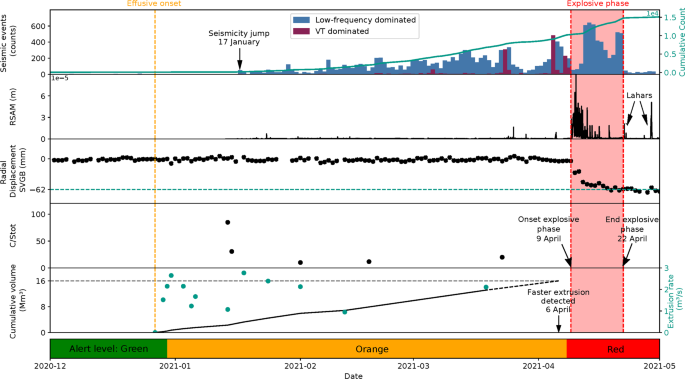
Seismicity data: daily (bars) and cumulative (teal line) seismicity observed and a marker on the first important increase (17 January). The bars in blue represent seismic events related to fluid dynamics (low-frequency and dome emplacement) and the bars in dark red represent VT events. RSAM values: calculated with 1 min windows and no overlap; they correlate with VT swarms and explosive phase. Moreover, it shows evidence of lahar signals after the explosive phase. Deformation: radial extension from the vent observed at station SVGB, 9 km away from the crater, and associated uncertainties computed with GAMIT/GLOBK 48 . It shows a total movement of 62 mm towards the crater at the end of the explosive phase. C/S tot (CO 2 /H 2 S) concentration ratios (ppm) in the plume from MultiGAS measurements: First two data points evidence only H 2 S content, the remaining are a combination of H 2 S and SO 2 . The arrow shows the onset of explosive activity. Dome extrusion data: cumulative volume extruded in black line with an extrapolation until 6 April, extrusion rate in teal dots; the arrow marks the onset of rapid dome inflation as observed by a remote camera. The lowest bar shows the corresponding alert level for each day. In addition, vertical dashed lines show the onset of the effusive phase (orange) and the red area corresponds to the explosive phase.
Although dome extrusion started on 27 December 2020, no seismicity was recorded until 6 January 2021, with an average of two events per day up to 17 January, when there was a sharp increase to 60 events per day. Subsequently, low frequency (0.5–5 Hz) 10 , 11 events were observed and interpreted as related to the dome emplacement; the events were recorded only by the closest stations indicating a shallow source. Volcano-tectonic (VT) swarms occurred during 23–24 March 2021 (226 events) with >95% located at depths shallower than 5 km; and 5–6 April 2021 (476 events) with an abrupt transition to deeper locations (Fig. 3 ), which was interpreted as a new volume of magma ascending from ~10 km depth.
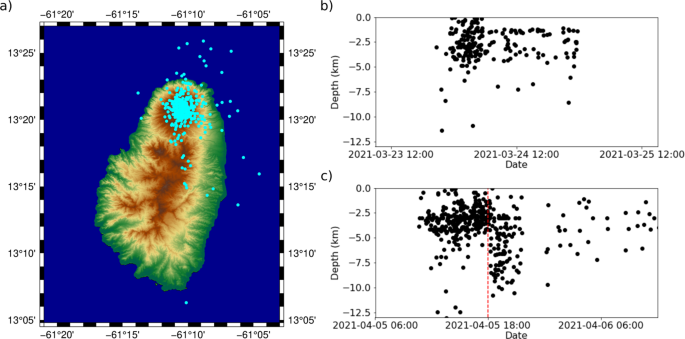
a Epicentres calculated showing concentric distribution. b Temporal evolution of depths during 23–24 March, most seismicity is shallower than 5 km. c Temporal evolution of depths during 5–6 April, seismicity is shallower than 5 km until 18:00 UTC on 5 April, when locations transitioned to deeper levels.
Banded tremor 12 , of increasing magnitude, began around noon (UTC time) on 8 April 2021, recorded by the closest stations at intervals of ~2.5 h (Fig. 4a ). This change was interpreted as indicating an imminent explosive phase 13 , with a source attributed to the excitation of shallow gas and fluid pockets 14 , 15 . The spectral content up to 10 Hz suggested that the banded tremor consisted of merging VT events (Fig. 4a ). The 8 th cycle transitioned to continuous tremor with increasing amplitude and stable frequency content over time (Fig. 4 ), suggesting repetitive events at a constant rate 13 . The first explosion was recorded at 12:41 UTC on 9 April, followed by a period of sustained, but pulsing, explosive activity and tremor from 16:00 UTC on 9 April to 06:00 UTC on 10 April (Fig. 4 ).

a Vertical time series at station SVV, RSAM and spectrogram showing the main features of the signal during the first 3 days: banded tremor, continuous and discrete explosions with exponential decays. b Vertical time series at station SVV, RSAM and spectrogram showing the main features of the whole explosive phase: increasing inter-explosion time, tremor build up to the last explosion and an abrupt end of the low-frequency tremor two hours after the referenced explosion. It also shows a lahar signal around 8 h after.
The time series, RSAM and spectrograms of the explosive phase is shown in Fig. 4 . The initially rapid rate of explosions and associated tremor made individual seismic events difficult to identify. Four stations stopped transmitting data during the first 36 h of the explosion sequence. Spectrograms for the explosive phase (Fig. 4a ) show a larger amplitude but the same stable frequency as during the build-up. Each explosion lasted between 3–23 min, followed by 2–3 h of exponential decay in tremor amplitude (green arrows in Fig. 4a ). Over the following two weeks, the pattern of seismic activity included episodes of short tremor bands accompanied by enhanced venting or explosive activity. Episodes of tremor were interspersed with long-period and hybrid earthquakes, with their rates of occurrence gradually decreasing prior to a period of high-level tremor on 22 April. The last explosion on 22 April was preceded by several hours of increasing-amplitude tremor (Fig. 4b ), with an abrupt end of low-frequency tremor shortly after the explosion. Seismic activity steadily declined from 22 April to early May, from an average of 354 events/day to 24 events/day. Up to November 2021, the seismicity remained sparse, dominated by low-frequency events.
Ground deformation monitoring
Forewarning of the effusive eruption was not recognised on the existing continuously operating GPS network (Fig. 2 ). However, a <10 cm line-of-sight shortening signal was observed in the crater area using ALOS-2 and Sentinel-1 radar, sometime between 19 and 31 December 2020. The associated deformation source was modelled as a ~63,000 m 3 dike intrusion, shallower than ~500 m deep (Fig. 5 ). Subsequently, no deformation was detected from the SAR platforms. No deformation was detected on the EDM time series during the effusive phase.
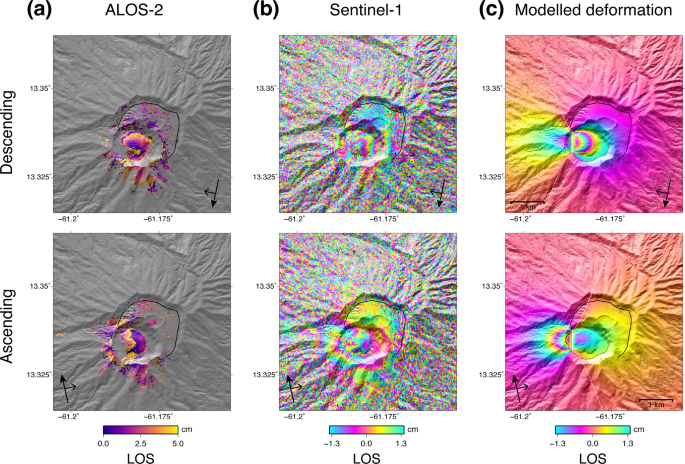
These visualisations use the Grandin and Delorme (2021) DSM. a Interferograms for descending (2020/02/25–2021/01/26, path 131, frame 3350) and ascending (2020/01/15–2021/01/13, path 36, frame 250) ALOS-2 radar. One fringe represents 11.4 cm in the line of sight; b Interferograms for descending pass (2020/12/07–2020/12/31, track 156, incidence 44.5°) and ascending (2020/12/07–2020/12/31, track 164, incidence 43.9°) Sentinel-1 radar. One fringe represents 2.8 cm in the line of sight; c Synthetic deformation predicted by an Okada dislocation dipping vertically (along-strike length: 600 m, along-dip width: 700 m, upper edge depth: 15 m), opening with a potency of 63,000 m 3 .
Onset of the explosive phase was accompanied by a rapid deflation recorded on the continuous GPS network on 9 April 2021 (Fig. 2 ). Between 9 and 22 April 2021, the SVGB station (Fig. 2 ) measured an overall cumulative horizontal displacement of ~43 mm northward and ~37 mm eastward and a subsidence of ~81 mm. Using a Mogi point source 16 , the associated surface deformation was modelled by migration of ~50 × 10 6 m 3 of magma from a source at ~6 km depth. After explosive activity ended, slow deflation was observed over several months.
Gas and geochemical monitoring
Gas measurements in January 2021, using UV spectrometer and MultiGAS instruments , detected no SO 2 . The concentration ratio (ppm) of carbon to total sulphur (C/S t ) was measured by MultiGAS at the summit (Fig. 2 ). A C/S t (=CO 2 /H 2 S) ratio of 85 and 30.6 (Fig. 2 ) was obtained on 14 and 15 January, respectively. Minor SO 2 (<1 ppm) was detected in February 2021, with a C/S t (=SO 2 + H 2 S) concentration ratio of 10 measured on 1 February and 11 on 18 February, before increasing to ~20 on 23 March 2021. Plume compositions during the effusive phase were dominated by a hydrothermal signature (Fig. 6 ). On the afternoon of 8 April, a coastal traverse yielded the first detection of SO 2 in the gas plume with a mass flux of 80 tonnes/day. The TROPOMI instrument on board Sentinel-5P also detected SO 2 during an overpass on 8 April at 17:25 UTC, confirming the change in plume composition. During the explosive phase (9–22 April) only satellite (Sentinel-5P) SO 2 measurements were possible, with values ranging from 2.76 × 10 5 tonnes/day on 10 April to 331 tonnes/day on 22 April. Over the two months following the explosive phase, coastal traverse measurements of SO 2 flux decreased from ~800 to ~200 tonnes/day, and then maintained this average through to November 2021.
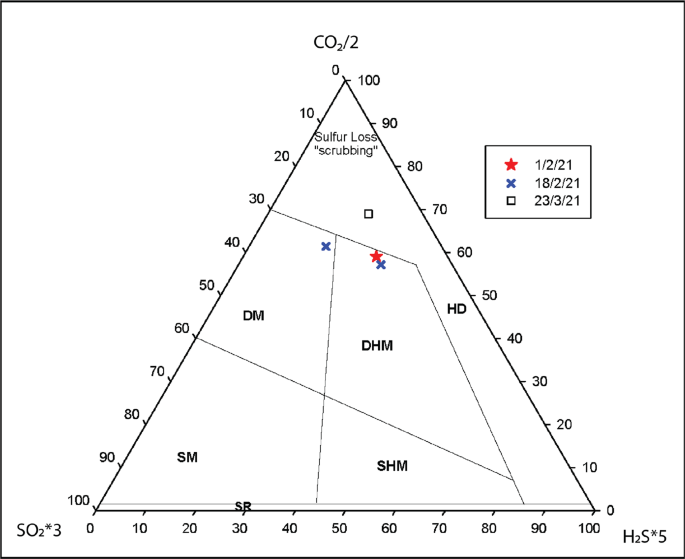
Ternary diagram of SO 2 *3-CO 2 /2-H 2 S*5 showing the plume compositions obtained during the extrusive phase. HD hydrothermal dominated, DHM deep hydrothermal magmatic, SHM shallow hydrothermal magmatic, DM deep magmatic, SM shallow magmatic. Boundaries were obtained from the Central American Volcanic arc.
On 16 January 2021, samples were collected from the front of the lava dome. In April 2021, scoria and clasts from pyroclastic density currents emplaced during the explosive eruptions were sampled. XRF analysis of major elements shows both have basaltic andesite bulk compositions (Fig. 7 ).
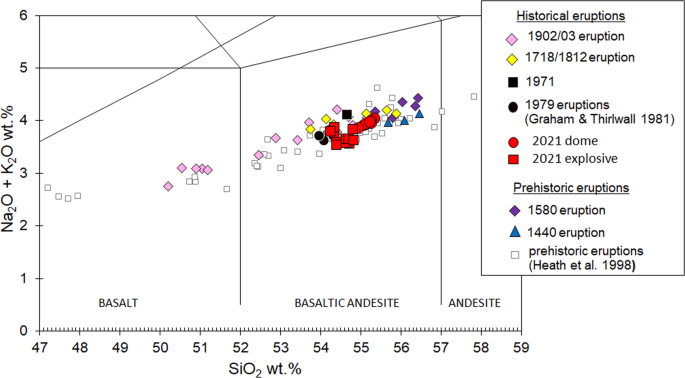
TAS classification diagram (‘Total Alkalis vs Silica’) to compare the composition of the 2020–2021 dome and other explosive products with other eruptions of La Soufrière, St. Vincent. Results were obtained by XRF at the University of Plymouth.
Preliminary petrographic analyses of the dome rocks indicated a phenocryst assemblage similar to past eruptions, consisting of plagioclase, clinopyroxene and Fe-Ti oxides with sparse olivine and abundant gabbroic clots 17 (Fig. 8 a, b ). Where present, olivine is invariably heavily altered, with symplectites intergrowth of forsterite and Fe-oxides common (Fig. 8b ). Groundmass textures show evidence of late-stage disequilibrium, including groundmass crystals with localised alteration of orthopyroxene microlites to Fe and Mg oxides (Fig. 8c ). Dome rocks are vesicular with textural evidence for fracturing and annealing of fluid pathways (Fig. 8a, d ).
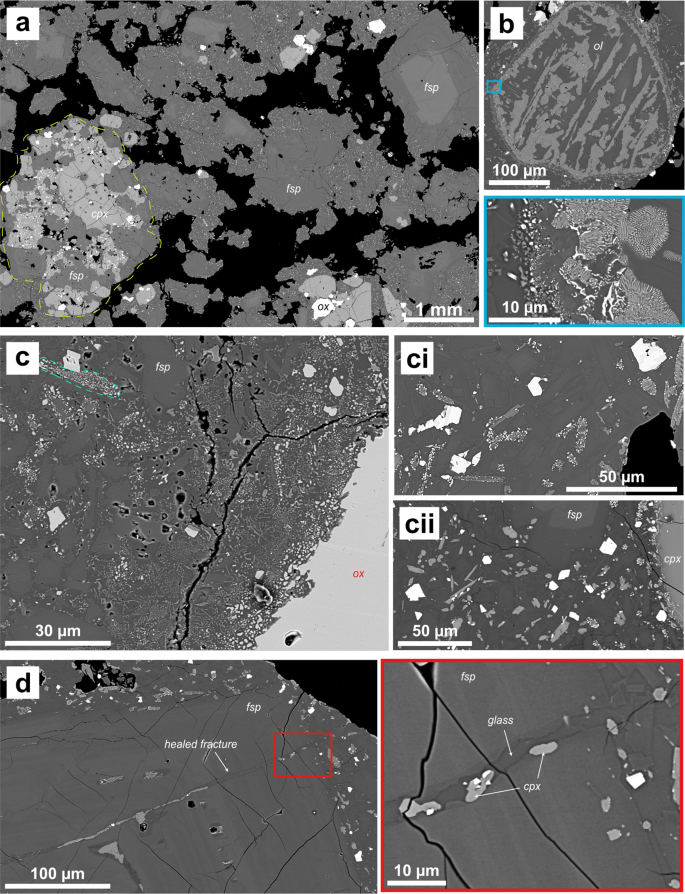
Five full thin section image maps, acquired on a Zeiss Gemini 300 SEM at the University of East Anglia, UK, were generated from clasts sampled in January 2021 from the growing dome and analysed to identify common textures as displayed in a – d . a Image showing vesicular nature of the dome sample (vesicles in black) with examples of the crystal population labelled: plagioclase (fsp), clinopyroxene (cpx), Fe-Ti oxides (ox) and gabbroic clots (outlined by yellow dashed line). b Example of heavily degraded olivine (ol) (blue box) shows close-up of this texture. c Examples of localisation of degradation of orthopyroxene crystals to oxides (dashed turquoise line in c ). Higher levels of degradation observed close to larger oxides (e.g. image c and ci, x) comprises ~5% of each thin section. Elsewhere, orthopyroxenes are un-degraded (cii, y). d Example of a plagioclase phenocryst (fsp) with a fracture that has been later filled by melt and crystals, this is observed several times across the five sections analysed. Red box shows a close-up of this structure showing clinopyroxene, oxides and glass infilling the fracture.
Dome growth and other visual observations
Initially, the new dome grew uniformly in all directions, reaching 70 m in height, subsequently elongating in the NW-SE direction (Fig. 9 ). Gas vented through a small depression in the dome’s summit. The shape evolved to an elliptical lava coulee with two distinct lobes, confined within the moat between the 1979 dome and the inner wall of the Summit Crater (Fig. 9 ). Rock fall activity from the margins was very limited, while no deformation of the crater floor was observed in flow fronts. Distinct marginal levees developed with radial and linear flow patterns appearing on the lava surface. Thermal images on 16 January 2021 yielded surface temperatures of up to 600 °C.
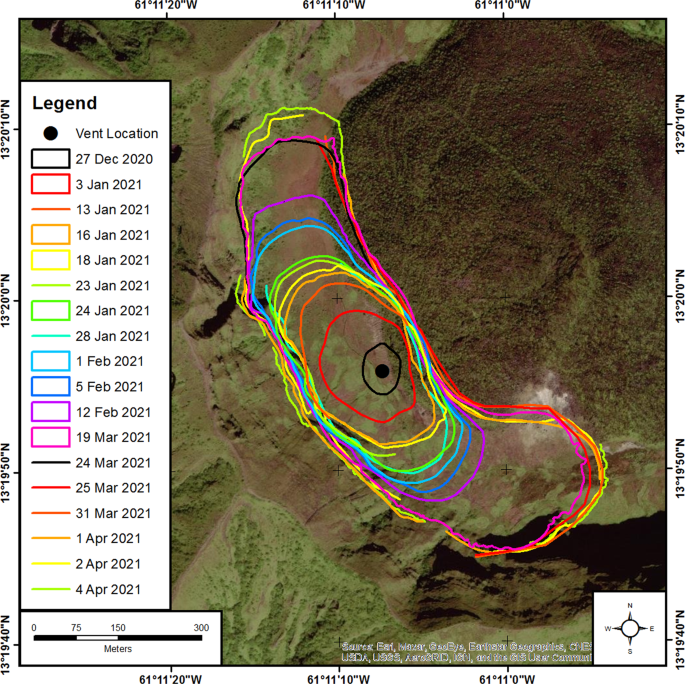
A map of the summit crater of La Soufriere, St Vincent, showing full and partial footprints for the new lava dome that first appeared on 27 December 2020. Footprints were extracted from multispectral and radar satellite imagery, oblique aerial and terrestrial photographs and drone surveys. Background is pre-eruption imagery that shows the 1979 lava dome inside the summit crater.
Extrusion rates calculated for periods from 1 to 34 days varied between 0.95 and 2.65 m 3 /s ± 0.59 m 3 /s with a long-term average of ~1.85 ± 0.14 m 3 /s (Fig. 2 ). The cumulative volume reached ~13 × 10 6 m 3 by 19 March 2021, when the dome measured 912 m long, 243 m wide and 105 m high. Extrapolating the linear trend through to 9 April suggests a final volume of ~18 × 10 6 m 3 . On 6 April, observation via the installed camera indicated a rapid increase in dome height with incandescence becoming visible over the crater rim from the Belmont Observatory (Fig. 1 ) on the evening of 8 April. Cyclic gas emissions at the central vent occurred correlated with the banded tremor. During the explosive activity, the new lava dome and significant parts of the 1979 lava dome were destroyed, as confirmed by satellite imagery on 10 April from ICEYE (02:02 UTC) and Capella (14:03 UTC).
As explosive activity intensified close observation of discrete events became more difficult. By 12 April pyroclastic density currents (PDCs) had descended several valleys on the southern and western flanks of the volcano and reached the sea. Following that, enhanced venting or Vulcanian-style explosive activity episodically occurred until 22 April. Some explosions generated PDCs in valleys on the western flanks of the volcano.
Crisis response: warning and decision-making systems
The SRC supports local authorities for strengthening preparedness and communicating volcanic hazards through product development (e.g., integrated volcanic hazard maps). The map for St. Vincent (Fig. 1 ) is a colour-coded depiction of the expected impact of volcanic hazards across the island 7 . The volcanic alert level system (VALS, see Supplementary Information ) translates the volcanic activity level into required actions during volcanic unrest. Operational constraints in country meant that any increased likelihood of an explosive eruption needed to be communicated 24–48 h before onset to enable successful evacuation.
Distinguishing rapid accelerations in activity after the onset of an eruption, in particular, transitions to an explosive eruption, are a globally recognised forecasting challenge 18 . It is also important to recognise when the probability of explosions decreases, to lower the alert level. Here we identify the practical challenges in recognising and communicating these changes. We highlight the importance of preparedness, diverse forms of communication, and structured approaches to the interpretation of scientific data, development of evidence-informed forecasts and assessment of risk during volcanic crises.
Short-term contribution to decision-making: assessment of risk
Current uncertainty in understanding volcanic processes contribute to a variety of opinions on causative mechanisms and prognoses, particularly during an evolving crisis. In addition, the aleatoric uncertainty associated with the complex behaviour of volcanic systems requires caution against a deterministic interpretation that over-emphasises one specific outcome 19 . SRC used the framework of a structured expert elicitation 20 , 21 around a range of scenarios, to generate both consensus (a collective ‘most likely’ prognosis) and to represent the diversity of opinions.
Weekly elicitations (January to early March 2021) favoured continuation of effusive activity (~80%) each time. The likelihood of an escalation to explosive activity in the following weeks remained at median probability of ~10%. However, following the first VT swarm (23–24 March), elicited estimates for a transition to explosive activity doubled to a median probability of ~20%. With the appearance of banded tremor (8 April), elicited probabilities of explosive activity tripled to a median value of ~60%. The authorities of SVG were alerted to this increase in volcanic activity. The alert level was raised to Red on 8 April at 18:00 UTC triggering the evacuation of ~16,000 persons from the Red and Orange Zones, prior to the start of explosive activity on 9 April at 12:41 UTC, with no reported serious injuries or loss of life.
The visual observations of declining surface activity, lowered seismic activity and declining gas output, coupled with the slow deflation signal observed since 22 April, were key drivers for the lowering of the alert level to Orange on 6 May.
Longer-term contribution to decision-making: risk awareness, preparedness and communication
Hazard assessments and analysis of past events have continuously been updated in response to new understanding 22 , 23 , 24 , 25 , 26 . Further, improvements in communication of improved understanding of hazards have been assessed and implemented in hazard planning by NEMO and SRC. The Volcano Ready Community Project (VRCP) led by SRC in collaboration with NEMO, launched in April 2018 and completed in April 2021, targeted twelve northernmost communities of St. Vincent in the Red and Orange hazard zones of the most recent volcanic hazard map 7 . The VRCP, enabled community plans to be drafted and integrated into the national response mechanisms prior to the 2020–2021 eruption.
Communication pathways: transition from extrusive to explosive
Communication of messaging between SRC and NEMO was harmonised. A continuous flow of near real-time information was provided to the public and stakeholders about volcanic activity, hazards, and risk reduction. These communications maintained credibility in the monitoring capability of SRC 27 , 28 . A similar communication strategy employed by the USGS, in response to the 2014–2015 Kilauea volcano lava-flow crisis, was shown to be a highly effective approach 29 and aligns with volcano observatory best practices for operations during crises 6 .
Based on best practice and evidence, risk communication products were developed to target different learning styles, media platforms and preferences 28 . These products included visual, print and audio products, and were combined with live scientific presentations during media interviews and to special interest groups. Social media schedules and posts were coordinated, while SRC scientists on island participated in daily activity updates on local television and radio stations, and provided cabinet briefings and updates to decision-makers. Scientists participated in virtual and drive-through community meetings for Red Zone residents with live online streaming and simulcast on local television and radio. An important facet of uncertainty during eruptions is dealing with misinformation and rumours. The strategy of maintaining a continuous presence on social media (Fig. 10 ) and the use of FAQs and short interviews allowed growing concerns or misapprehensions to be addressed. The frequency of these communications was influenced by changes in the ongoing activity. International scientists were also encouraged to amplify existing messages and use SRC materials in discussing the eruption with their local media.
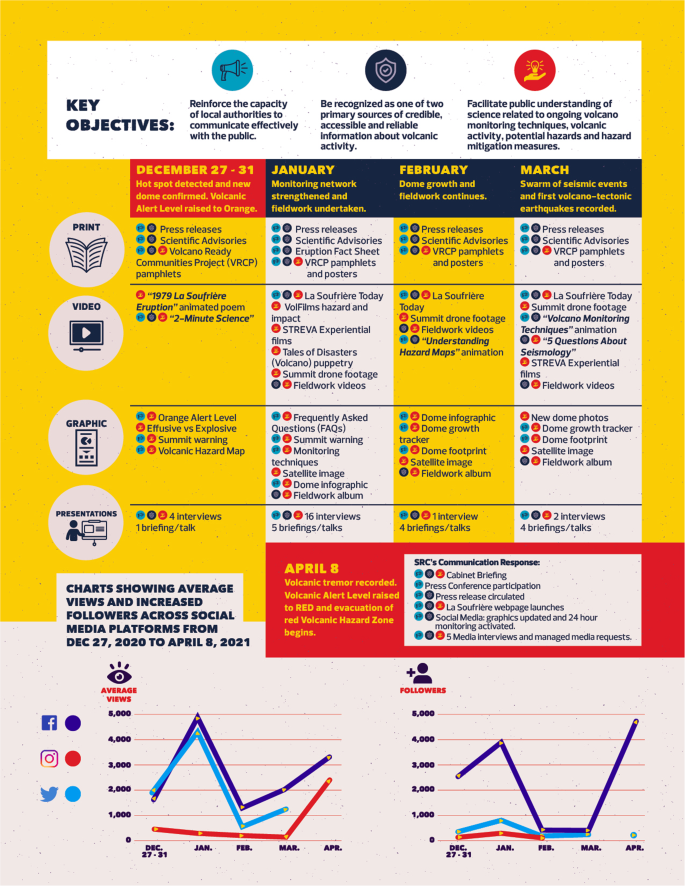
Summary of UWI SRC communication strategy and response throughout the 2020–2021 eruption of La Soufrière, St. Vincent eruption.
Another important dimension was systematised internal communication. External contributions of data were facilitated by a team lead who was responsible for internal communication and coordinating data requests. This approach also facilitated international collaborations and engagement with academic scientists, which supported the SRC to develop conceptual models.
With the start of the explosive phase of the eruption, social media posts were still the primary tool used by SRC to communicate with the public. Scientific bulletins were shared directly on these platforms, with the addition of voice notes shared via mobile networks. Daily activity updates on local radio and television stations continued. Visual, print and audio products now also focussed on explanations of, and recommended responses to, the primary volcanic hazards (pyroclastic density currents, ash fall and lahars) being observed.
Crisis management
Volcano monitoring data enable scientists to provide short-term forecasts or advise of possible changes during an ongoing eruption 30 . However, for successful crisis management, monitoring data and interpretations need to be: (a) framed within the context of wider scientific knowledge, (b) presented in the context of decision-making (‘useful, usable and used’) 31 and (c) effectively communicated to diverse audiences 32 . The St. Vincent case provides an important demonstration of how these principles were integrated, complementing synoptic analyses of the state-of-the-art in volcano observatory crisis operations 6 , 33 . Next, we discuss the key lessons from our analysis of response to the unfolding events, particularly the eruptive transition, and assess the role data and models played in decision-making. We also reflect on the constraints on best practice imposed by finite resources, and how this can be improved.
Conceptual models and their value in forecasting eruptive transitions
Historically, La Soufrière volcano can produce both explosive and effusive eruptions over time intervals of weeks to months. However, transitions in behaviour can occur over only a few hours 6 and pose acute challenges to risk management; particularly when decisions to evacuate are exacerbated by resource or space constraints that affect the tolerability of evacuations. Analysis of previous eruptions in St. Vincent has demonstrated that compliance with long-duration evacuations will dissipate, a feature shared with crises at other volcanoes 4 .
A working conceptual model of volcanic behaviour was created and developed in real-time, which was used to inform the scientific response to emergency management and advise the authorities. Critically, during the effusive phase our evolving working model was used to anticipate explosive transition or other significant changes in activity.
In early January 2021, we interpreted onset of the eruption as the consequence of the injection of fresh gas-rich magma into a sub-volcanic reservoir, making its way to the surface 3 . However, this interpretation could not explain the comparatively low seismicity rates, lack of surface deformation and near-constant extrusion of lava (Fig. 2 ). The presence of a ductile well-connected magma ascent pathway was proposed to reconcile these early seismic observations 34 . The absence of deformation and steady extrusion could be explained by either (i) a magma source that maintains a near-constant overpressure 35 or (ii) that a large magmatic source, relative to the material extruded, resulted in pressure decay in the reservoir being too small to be detected 36 , 37 or (iii) that hot magma mush surrounding the source region, in combination with the viscous flow in the crust, maintained the high pressure 37 , or (iv) some combination of these processes. The diversity of explanations, informed by monitoring observations, was important for assessing the potential for explosive activity, and the timescale over which this might happen. At that time, there were no evacuations in place, but existing hazard assessment and outcomes from past simulations (e.g., Tradewinds Exercise 2019 38 ) demonstrated that risk to the northern population could rapidly become high, with a 24–48 h interval needed for full evacuation.
By early February, the absence of detectable SO 2 , however, led us to infer the presence of degassed magma remaining within the conduit, following the 1979 eruption, confined by a strong ‘cap’, was slowly being pushed up by a new injection of gas-rich magma. By early March, the similar composition and petrographic characteristics of the extruded dome rocks, in comparison to past eruptive products, had reinforced this model. Similar behaviour has been inferred at volcanoes such as Kilauea in Hawai’i, where in 2018 near real-time geochemical analysis of lava indicated magma characteristics consistent with progressive flushing of residual magma in the conduit 39 .
The epicentres of the intense seismic swarms before the explosions show a concentric distribution of earthquakes around the volcano (Fig. 3a ). This suggested magma ascending through the volcanic conduit. Most (>95%) of the estimated epicentres were located above 5 km until 18:00 UTC on 5 April, when seismicity migrated to deeper levels (Fig. 3a, b ). This sudden transition in depth was considered evidence of increased deviatoric stresses around the conduit, possibly related to a new intrusion of gas-rich magma.
In our evolving model, obstruction by the cap material and overlying 1979 dome prevented fresh magma from reaching the surface and limited SO 2 flux to volumes low enough to be scrubbed by the volcanic hydrothermal system, until April 2021. We speculated that the accelerated extrusion rate observed after 6 April, was after the high-viscosity magma cap was displaced by new lower viscosity gas-rich magma. Banded tremor, consisting of merging VT events, attributed to the excitation of fluids at relatively shallow levels, was observed one day prior to the onset of the explosive phase 14 , 15 . This observation suggested possible pressure oscillations within the ~6 km deep magma reservoir as the trigger of highly periodic tremor events. This strongly implied the imminent passage of gas-rich material from depth into the shallower edifice, consistent with the first detection of SO 2 flux on 8 April (Fig. 6 ). Then on 9 April, gas rich magma reached the surface and conditions for explosive fragmentation were realised, which correlated with the observation of syn-eruptive deflation (Fig. 2 ).
The working conceptual model provided a robust framework against which these rapidly emerging data could be interpreted and understood. This working model illustrates the need to interpret scientific data in real-time to inform rapid emergency decision-making and the difference between theoretical models and critical interpretations that trigger real-world, life-preserving decisions. The conceptual models, synthesised from quantitative data, were necessary for decision-making and formed a framework to create actionable evidence for responding to an acceleration in activity. Nonetheless, the conceptual model was also strongly informed by quantitative outputs from generic models for different aspects of volcanic behaviour and the input of boundary conditions obtained from new knowledge of the magma composition and observations of dynamic behaviour. Further scientific analysis with longer-term research programmes and quantitative modelling will test and improve these models. An important dimension of fully quantitative models is the recognition of generalizable insights relevant to other settings worldwide where rapid transitions in activity occur, that can be derived from empirical observations in real time.
The role of uncertainty and impact of monitoring in a resource-constrained setting
Interpretation of the monitoring data and development of a preliminary conceptual model were associated with large uncertainties when anticipating eruptive behaviour throughout the unrest episode. These uncertainties created both temporal (when) and spatial (how big) challenges. Specific uncertainties included: (i) interpreting the extent that seismic unrest patterns were similar to historical background seismic activity at La Soufrière volcano; particularly long episodes of unrest preceding >VEI4 explosions; (ii) during steady-state dome growth, distinguishing monitoring signals indicative of a potential acceleration of activity from normal behavioural fluctuations, in the absence of any significant measured deformation; and (iii) during the explosive phase anticipating the likely duration and peak intensity of explosions, given the range in size and documented intensity of the previous eruptions 8 . This contributed to uncertainties in interpreting signals that might represent the onset of an explosive phase and reduced timescales over which accelerations or decelerations in the intensity of activity could be confidently attributed to changing behaviour. Coping with uncertainties framed our conceptual model and attendant different scenarios. Our combined expert view of likelihoods captured via expert elicitation, fed into decision focussed advice (e.g., VALS for La Soufrière). This approach avoided interpretations dependent on single outcomes 19 , which inadvertently minimised aleatoric uncertainties or ignored ambiguities in datasets. The St. Vincent case demonstrates the benefits of the structured expert elicitation methodology to capture uncertainty.
An important factor in generating epistemic uncertainty was the relatively sparse monitoring network at the onset of the eruptive episode, which was a direct consequence of financial constraints on the monitoring operations. Limitations in the density of the network challenged our ability to definitively say whether the onset of the effusive eruption would have been instrumentally detected. However, as the monitoring network strengthened, observed signals were interpreted against improvements in data volume and accuracy. For example, additional GPS stations installed during the eruption greatly improved the sensitivity of the network. A sensitivity study 40 , demonstrated that the network had no significant azimuthal gaps, but suffered from a lack of near-field stations to capture shallow deformation sources. In addition, interpretation of the low amplitude banded tremor detected on 8 April, reinforced by the observation of a detectable SO 2 gas flux later that day, was the most salient information to feed into changed views on explosion likelihood. Similarly, detailed seismic analysis and near real-time satellite and deformation measurements contributed to the anticipation of waning explosive activity during the acute phase (9–11 April).
The relatively late detection of effusive eruption onset and the importance of new data during the eruptive transition, clearly demonstrate that well-resourced multi-parametric networks are of high value. The reality in settings like St. Vincent is often different and network strengthening took place during the eruption, creating important safety concerns. SRC used a fieldwork life-safety risk assessment 41 with an estimated hourly risk of fatality exceeding 10 −4 during the initial fieldwork period (see Supplementary Information ). This procedure gave strong justification for the use of a helicopter and provided an opportunity for monitoring scientists to express any concerns and contribute recommendations on the best field practices.
The value of collaborative preparedness, awareness and communication
Identifying local needs and obtaining evidence of the efficacy and impact of the SRC’s risk communication in the vulnerable communities 42 was a persistent challenge largely due to the Education and Outreach (E&O) team’s remote operations. Harmonisation of messaging was essential 43 . Close collaborations with NEMO strengthened communication efficacy and reinforced local capacity for effective communication. In turn, this provided SRC with insight into appropriate content for its communication products. These types of relations take time and resources. The groundwork was essential to the success of managing the crisis in a rapidly changing volcanic situation with a requirement for the implementation of advice into action.
Wide acceptance of the risk information was indicated by the authorities acting decisively on advice provided by SRC, resulting in increased alert levels and the issuance of evacuation orders 24 h ahead of the first explosion. Furthermore, the public understood the increased volcanic activity and complied with evacuation orders.
Integrated approach: value in anticipating eruptive transitions
Effective crisis science and consequent volcanic risk reduction is a partnership between scientists, response agencies and the affected communities 44 , 45 , It begins with the robust gathering and interpretation of scientific data, before, during and after a crisis. Our analysis provides an excellent case study of the principles outlined in recent synoptic analyses 6 , 33 .
However, important challenges arise in the acute crisis phase where decision-making timescale appropriate to the lifetime of the eruption (typically weeks to months) contract into minutes and hours with the growing prospect of a change in behaviour. As a transition threatens, uncertainty rises and demands dynamic interpretation of emergent datasets. Thus, our analysis here particularly reflects on the important drivers of risk in this moment.
An important dimension was the capacity to interpret data against a flexible conceptual model that expresses and formalises uncertainty. Further, the understanding from previous research 7 , 8 , 9 , 13 , 22 and agency-to-agency interactions that framed social context and societal constraints were important. Monitoring agencies need to be responsible for interpreting datasets and anticipating changes on societally relevant timescales. This responsibility also underpinned our communication strategies and timescales. The long-term relationship we described here increased the chances that advice given during an eruptive transition was more readily translated into actions by local emergency managers, and in turn, the populace at risk.
Research that accounts for the realities of managing crises could further improve effective decision-making. In volcanology, counterfactual analysis is a powerful way to understand what might have transpired 46 . A counterfactual analysis to include the range of possible scenarios and outcomes using the ‘real time’ evolving knowledge gathered, would assess whether the decision-making strategy here was robust to all eruptive outcomes. For example, considering situations where explosive activity happened at an earlier stage or explosions that generated larger pyroclastic density currents. Similarly, a focus on emerging petrological techniques that allow rapid forensic examination of timescales of disruption, degassing and ingress prior to other eruptive episodes would have significantly helped with the interpretation of changing monitored signals at the acute crisis point.
Finally, it is important to acknowledge the implicit risk to monitoring scientists during the intra-eruptive network strengthening. Our analysis demonstrates the value of the strengthened network, as well as remotely observed data, to data interpretation despite the risk in this particular case. Research that improves understanding of the effectiveness of monitoring networks would help identify strategies that best minimise risk, while maximising data benefit.
Operating in a resource-constrained setting influenced scientific response and emergency management. The steady global growth of disaster risk, volcanic or otherwise, compels disaster response agencies to fortify disaster preparedness capabilities and to ensure that institutional capacities are in place to optimize effective planning, response, and mitigation. Our assessment of the 2020–2021 La Soufrière eruption demonstrates the critical controls, produced over longer timescales, of an effective response during an acute crisis at the moment of eruptive transition.
Confidence in our conceptual models of reactivation via a gas-rich magma at depth was improved through the strengthening of the seismic network, real-time deformation and dome monitoring, changes in gas composition and petrological sampling. Nonetheless, as monitored signals shifted and the likelihood of transition increased, longer-term preparedness measures allowed us to disseminate rapidly changing information effectively on short timescales and contextualise our advice on timescales appropriate for actions to prevent loss of life, while minimising impacts on livelihoods.
The seismicity routinely used to assess the status of La Soufrière volcano derives from an eight-station network on and around the volcano. Daily event counts are used to recognise changes within the system. The rapid densification of the network in early January 2021 (Fig. 1 ) facilitated the recording of micro-seismic signals generated by the dome emplacement process, as well as the detection and location of VT earthquakes. The location inversion was performed using a generic volcanic velocity structure 47 , although this velocity model is not a result of 1D tomography, it provides consistent and clustered results when no shallow velocity structures are identified. The size of the remaining volcano earthquake types that could not be located was assessed by tracking the number and distance of stations recording those events along with the duration of the events as recorded by the crater rim station, SSVA and then by SVV. The recorded events were identified and processed by a team of seismology technicians at SRC and cross-checked with the seismologist on duty at the Belmont Observatory. An automatic event detection system was introduced after several weeks to support the analysis. Routine RSAM and spectral analysis calculations were also used in assessing the status of the system.
GPS data were collected using Trimble NetRS and NetR9, and Septentrio PolaRX5 dual-frequency receivers and processed using GAMIT/GLOBK software (version 10.71) 48 . EDM were captured from six base locations (Fig. 1 ) in collaboration with the Lands and Surveys Department, SVG using a Leica Flexline TS06 total station. Radar imagery was acquired from Sentinel-1 satellites of the European Space Agency (ESA) and the ALOS-2 satellite of the Japan Aerospace Exploration Agency (JAXA). The ALOS-2 images were originally made available under an ALOS-2 6th Research call project 49 and were then also made available through an emergency collaboration with NASA. Formal requests were made to ESA and JAXA for additional collections, which were subsequently granted. Sentinel-1 repeat times were increased from 12–18 days to 6 days and ALOS-2 repeat times were increased from approximately annual to every 14 days. ALOS-2 data were processed using the GAMMA software 50 and topographic corrections were made using the 30 m ASTER GDEM. Sentinel-1 data were processed with the NSBAS processing chain 51 , 52 which relies on the legacy software ROI_PAC 53 . Topographic corrections were made using the 1 Arc-second SRTM DEM, and atmospheric corrections were performed using ECMWF’s ERA-5 meteorological reanalysis 54 .
A portable Multi-component Gas Analysing System (MultiGAS) instrument composed of an infrared spectrometer and electrochemical sensors (plus air temperature, atmospheric pressure, and relative humidity sensors) allowed detection of the in-plume concentrations (ppm) of H 2 O, CO 2 , SO 2 and H 2 S 55 . The instrument consists of a Gascard IR spectrometer for CO 2 determination (calibration range: 0–3000 ppmv; accuracy: ±2%; resolution: 0.8 ppmv) and of City Technology electrochemical sensors for SO 2 (sensor type 3ST/F; calibration range: 0–200 ppm, accuracy: ±2%, resolution: 0.1 ppmv), H 2 S (sensor type 2E; range: 0–100 ppm, accuracy: ±5%, resolution: 0.7 ppmv) and H 2 S (sensor type EZT3HYT; range: 0–200 ppm, accuracy: ±2%, resolution: 0.5 ppmv), all connected to a Campbell Scientific CR6 datalogger. The acquired data were post processed using the Ratiocalc software 56 with CO 2 /S t ratios expressed in molar ratios,
Rock samples were collected directly from an active lobe of the dome on 16 January 2021, using a bucket. These were crushed and analysed from bulk composition using XRF. Subsequently, samples of scoria (erupted 9 April) and blocks from PDCs (emplaced 13 April) were also analysed. The dome samples were thin sectioned by Jesús Montes Rueda at the University of Granada and by Ian Chaplin at Durham University, and carbon coated. Scanning Electron Microscopy (SEM) imaging with Energy Dispersive Spectroscopy (EDS) analyses were conducted at the University of East Anglia (Zeiss Gemini 300 field emission SEM with Oxford Instruments Ultim Max 170 EDS). Imaging and analysis were conducted at 10 kV (UEA) with a working distance of 8.5 mm.
Dome volume monitoring
Growth of the new lava dome was monitored primarily through the application of photogrammetry, using images acquired from the summit crater rim or aerial images from observation flights using fixed-wing aircraft, helicopters or consumer grade unmanned aerial vehicles (UAVs). Images were processed using either ImageJ or the photogrammetry software package AgiSoft Metashape, the later used to generate 3D models of the lava dome from which volume and extrusion rates were determined. Due to the lack of a quality pre-eruption DEM, it was assumed that the dome had a purely flat base and exhibited either a pure hemispherical or half ellipsoidal shape. In reality, where the new lava dome reached the 1979 lava dome and the inner slopes of the Summit Crater wall, the dome had a slightly trapezoidal cross-section. Consequently, the volume data presented in Fig. 2 is overestimated by as much as 20%. The photogrammetry surveys were conducted at intervals of up to 34 days due to access and safety concerns (they were conducted from locations along the rim of the Summit Crater). Between surveys, radar and multispectral imagery from the Sentinel-1 and -2 satellite constellations and from Planet.com were used to track the extent of the footprint of the new lava dome.
Hazard and risk evaluation
Two complementary activities were undertaken to quantify anticipated risk from the La Soufrière and provide an evidence base for internal decision-making during the eruption. The first, a fieldwork life-safety risk assessment provided estimates of the chance of fatality from an unheralded explosive event, which was a concern during the initial stages of the eruption when network strengthening fieldwork had to be conducted. The second, a formal approach to eliciting expert judgement, provided quantitative estimates of the likelihood for anticipated eruption scenarios that could inform both the fieldwork life-safety risk assessment and the provision of advice for emergency response and public safety throughout the eruptive sequence. This was undertaken on a regular basis to quantitatively assess the evolution of volcanic activity and possible future scenarios.
The fieldwork life-safety risk assessment was conducted following the VoLREst methodology 37 . The two-step procedure involved: (1) establishing the volcano-specific parameters, e.g., vent location, sites of interest, hazards of concern, eruption size categories, probability of exposure, probability of fatality and threshold of acceptable risk and (2) estimating eruption probabilities. Ideally the first step is undertaken in advance of any activity, in this instance parameters were identified after the extrusive eruption commenced, including elicited probabilities of exposure and fatality. Probabilities for step two were taken from the expert-elicitation for anticipated eruption scenarios. These values are combined in VoLREst to calculate hourly risk of fatality with increasing distance from the volcano (see Supplementary Fig. 4 ).
A structured elicitation process was initiated on 7 January 2021 to provide a framework for estimating quantitative probabilities of different eruption scenarios, particularly the likelihood of escalated eruptive (explosive) activity. Given that the eruption had already commenced, with extrusion at the surface in the form of a dome, three possible outcomes for the next stage of volcanic activity were considered: (i) effusive activity continues; (ii) eruption ends; and (iii) escalation to explosive activity. These scenarios formed the core of the questions during the elicitation, with probabilities elicited on a biweekly basis, with flexibility in adjusting the timing and content to address changing volcanic conditions, additional monitoring data, and/or questions that arose (both internally and externally) regarding possible scenarios.
The elicitation process included a briefing that was held approximately every two weeks to provide updates on the status of the volcano and monitoring operations. Previous elicitation results were discussed in depth during each meeting, together with a review of the scientific working model of the volcano and its ongoing eruptive state, and finally any possible changes to the elicitation questions. The group was then elicited immediately following the meeting, such that the estimated probabilities were based on consistent information available to all participants. Participants were asked to provide estimates of the median likelihood of a given event in a set time period, as well as estimates of 5 and 95% quantiles, to provide uncertainty ranges on their values. The Excalibur software package 19 , which implements Cooke’s “Classical Model” 18 , was used to undertake the calculations. Estimates for the following one-week period and one-month period were elicited.
Early warning and preparedness
The Volcano-Ready Communities in St. Vincent Project (VRCP) was a grant funded community-based capacity-building programme that aimed to reduce vulnerability to the multi-hazard environment of the La Soufrière volcano across twelve (12) communities in St. Vincent. It was executed during the period April 2018 to November 2021 through collaborations involving the SRC, NEMO, the Red Cross Society and the Community Development Division of St. Vincent and the Grenadines.
Project activities were designed to enhance community early warning procedures; increase adaptive capacities; strengthen awareness; and enhance response capacities to enable community residents to effectively plan, prepare for and respond to the impacts of volcanic and other hazards. Activities included the production of a variety of print and digital public awareness and education materials (posters and brochures, film, photographs and public exhibits) disseminated through a series of multi hazard, gender-sensitive community sessions that facilitated public engagement. Community awareness and education materials included documentaries on best practices and lessons learnt from the 1979 eruption, were also captured through story telling in film, animation and photography. A total of four one-week educational sessions were conducted between the months of April 2018 and October 2019, involving both secondary school students and volunteers (32–45 participants per session). Other public awareness education activities included a crisis management scenario workshop, attended by 120 Fourth Form geography students, where students also participated in practical experiments that demonstrated the science of volcanic eruptions. In addition, a group of 80 Fourth Form students took part in a guided field visit to the volcano’s summit, where they were introduced to SRC’s volcano monitoring mechanism for La Soufrière volcano and its evolution since the 1979 eruption.
In addition, training and Workshops were conducted with community volunteers to develop community level volcano emergency plans for the citizens in the high-risk Red Zone of the Soufrière Volcano. Two workshops: (1) Initial Damage Assessments (IDA) and (2) Vulnerability and Capacity Assessments (VCA), were held with fifteen persons from seven communities located in the Red Zone participating in both workshops. The group consisted of four males and eleven females, with eight participants comprising of young adults (15–24 years). This facilitated incorporation of community hazard maps and databases identifying and mapping vulnerable persons, human and transportation resources for each community to be integrated into the national response mechanisms.
Community Emergency Response Teams (CERTS) certification training was also conducted for each community, with a total of 72 community volunteers being trained under this program. Participants were instructed on disaster preparedness for volcanic and other hazards that may impact their community and trained in basic disaster response skills, such as fire safety, light search and rescue, team organisation, and disaster medical operations. In addition, participants also received information on: Introduction to Disaster Management, Mass Care, Damage Assessment and Shelters and Shelter Operations. In addition, CERT teams were provided with personal and community emergency response tools and equipment upon completion of the training. Stakeholders (government, civil society, private sector) were engaged to assist four communities with the development and identification of resources for the implementation of the community response plans and provide support to test the National Volcanic Emergency Response Plan during Tradewinds 2019 38 .
Risk communication
One of the key functions of the SRC is to provide information and scientific advice to governments, as well as to a large body of disaster management stakeholders and the general public. This was achieved through regular updates on volcanic activity as well as monitoring plans and techniques. At the onset of the eruption, the main objectives identified to guide the risk communication strategy were (i) to reinforce capacity of local authorities to communicate effectively; (ii) to promote public recognition of primary sources of information and (iii) to facilitate public understanding of science related to ongoing volcano monitoring techniques, volcanic activity, potential hazards and hazard mitigation measures.
The Education & Outreach (E&O) section of the SRC set out to reinforce NEMO’s capacity by supporting the implementation of its communications plan. This was executed through regular consultations between the two agencies to share communication expertise and collaborative hosting of key public education activities. The SRC developed communication products to address specific areas of need.
As part of intensified efforts to reinforce public recognition of primary sources of information, SRC spokespersons were identified for the eruption, visibility and responsiveness on social and traditional media were increased and published communication products were branded with SRC logo. A standardized statement identifying SRC and NEMO as official information sources were integrated as a consistent message across products, including interviews.
Where possible, communication products contained jargon-free language and alternatively, simple explanations for technical terms were provided where the scientific language was unavoidable. A customised communications approach to address different learning styles was adopted and information was disseminated through multimedia to targeted audiences. Eruption-related questions trending on SRC social media platforms provided the basis for these user-informed products.
Data availability
The raw datasets that informed the analyses presented in this study are available from the corresponding author on request. Sentinel products were freely downloaded from the Copernicus Open Access Hub ( https://scihub.copernicus.eu/ ).
Bebbington, M. S. & Jenkins, S. F. Intra-eruption forecasting. Bull. Volcanol. 81 , 1–17 (2019).
Article ADS Google Scholar
Sparks, R. S. J. & Cashman, K. V. Dynamic magma systems: implications for forecasting volcanic activity. Elements 13 , 35–40 (2017).
Article Google Scholar
Cassidy, M., Manga, M., Cashman, K. & Bachmann, O. Controls on explosive-effusive volcanic eruption styles. Nat. Commun. 9 , 1–16 (2018).
Article CAS Google Scholar
Barclay, J. et al. Livelihoods, wellbeing and the risk to life during volcanic eruptions. Front. Earth Sci . 7 https://doi.org/10.3389/feart.2019.00205 (2019).
Colwell, R. & Machlis, G. Science during crisis: best practices, research needs, and policy priorities. Am. Acad. Arts Sci . 1-32 (Cambridge, MA, 2019).
Lowenstern, J. et al. Guidelines for volcano-observatory operations during crises: recommendations from the 2019 volcano observatory best practices meeting. J. Appl. Volcanol. 11 , 1–24 (2022).
Robertson R. St. Vincent. In Volcanic Hazard Atlas of the Lesser Antilles (eds Lindsay J. et al.). (Seismic Research Unit, University of the West Indies, 2005).
Cole, P., Robertson, R., Fedele, L. & Scarpati, C. Explosive activity of the last 1000 years at La Soufrière, St Vincent, Lesser Antilles. J. Volcanol. Geotherm. Res. 371 , 86–100 (2019).
Article ADS CAS Google Scholar
Aspinall, W., Sigurdsson, H. & Shepherd, J. Eruption of Soufrière volcano on St. Vincent island, 1971-1972. Science 181 , 117–124 (1973).
Article ADS CAS PubMed Google Scholar
Lahr, J. C., Chouet, B. A., Stephens, C. D., Power, J. A. & Page, R. A. Earthquake classification, location, and error analysis in a volcanic environment: Implications for the magmatic system of the 1989–1990 eruptions at Redoubt Volcano, Alaska. J. Volcanol. Geotherm. Res. 62 , 137–151 (1994).
Green, D. N. & Neuberg, J. Waveform classification of volcanic low-frequency earthquake swarms and its implication at Soufrière Hills Volcano, Montserrat. J. Volcanol. Geotherm. Res. 153 , 51–63 (2006).
Konstantinou, K. I. & Schlindwein, V. Nature, wavefield properties and source mechanism of volcanic tremor: a review. J. Volcanol. Geotherm. Res. 119 , 161–187 (2003).
Shepherd, J. et al. The eruption of Soufrière volcano, St Vincent April–June 1979. Nature 282 , 24–28 (1979).
Cannata, A. et al. New insights into banded tremor from the 2008–2009 Mount Etna eruption. J. Geophys. Res.: Solid Earth 115 , 1–22 (2010).
Fujita, E. Banded tremor at Miyakejima volcano, Japan: implication for two‐phase flow instability. J. Geophys. Res.: Solid Earth 113 , B04207 https://doi.org/10.1029/2006JB004829 (2008).
Kiyoo, M. Relations between the eruptions of various volcanoes and the deformations of the ground surfaces around them. Earthq. Res. Inst. 36 , 99–134 (1958).
Google Scholar
Fedele, L., Cole, P. D., Scarpati, C. & Robertson, R. E. Petrological insights on the last 1000 years of explosive activity at La Soufrière volcano, St. Vincent (Lesser Antilles). Lithos 392 , 106150 (2021).
National Academies of Sciences E, and Medicine. Volcanic Eruptions and Their Repose, Unrest, Precursors, and Timing (The National Academies Press, 2017).
Papale, P. Rational volcanic hazard forecasts and the use of volcanic alert levels. J. Appl. Volcanol. 6 , 1–13 (2017).
Cooke, R. Experts in Uncertainty: Opinion and Subjective Probability in Science (Oxford University Press on Demand, 1991).
Cooke, R. M. & Solomatine, D. EXCALIBR Integrated System for Processing Expert Judgements version 3.0 (Delft University of Technology and SoLogic Delft, Delft, 1992).
Robertson, R. E. An assessment of the risk from future eruptions of the Soufriere volcano of St. Vincent, West Indies. Nat. Hazards 11 , 163–191 (1995).
Lindsay, J. M. & Robertson, R. E. Integrating volcanic hazard data in a systematic approach to develop volcanic hazard maps in the Lesser Antilles. Front. Earth Sci. 6 , 42 (2018).
Hicks, A. et al. Risk communication films: process, product and potential for improving preparedness and behaviour change. Int. J. disaster risk Reduct. 23 , 138–151 (2017).
Pyle, D. M., Barclay, J. & Armijos, M. T. The 1902–3 eruptions of the Soufrière, St Vincent: Impacts, relief and response. J. Volcanol. Geotherm. Res. 356 , 183–199 (2018).
Wilkinson, E., Lovell, E., Carby, B., Barclay, J. & Robertson, R. E. The dilemmas of risk-sensitive development on a small volcanic island. Resources 5 , 21 (2016).
Haynes, K., Barclay, J. & Pidgeon, N. The issue of trust and its influence on risk communication during a volcanic crisis. Bull. Volcanol. 70 , 605–621 (2008).
Fearnley, C. J., Bird, D. K., Haynes, K., McGuire, W. J. & Jolly, G. Observing the Volcano World: Volcano Crisis Communication (Springer, 2018).
Brantley, S. R. et al. Communication strategy of the U.S. Geological Survey Hawaiian Volcano Observatory during the lava-flow crisis of 2014–2015, Kīlauea Volcano, Hawai‘i. In Field Volcanology: A Tribute to the Distinguished Career of Don Swanson (eds Poland, M., Garcia, M. O., Camp, V. E. & Grunder, A.). (Geological Society of America, 2019). https://doi.org/10.1130/2018.2538(16) .
Tilling, R. The critical role of volcano monitoring in risk reduction. Adv. Geosci. 14 , 3–11 (2008).
Aitsi-Selmi, A., Blanchard, K. & Murray, V. Ensuring science is useful, usable and used in global disaster risk reduction and sustainable development: a view through the Sendai framework lens. Palgrave Commun. 2 , 1–9 (2016).
Fischhoff, B. The sciences of science communication. Proc. Natl Acad. Sci. USA 110 , 14033–14039 (2013).
Article ADS CAS PubMed PubMed Central Google Scholar
Lowenstern, J. B., Ewert, J. W. & Lockhart, A. B. Strengthening local volcano observatories through global collaborations. Bull. Volcanol. 84 , 1–9 (2022).
Umakoshi, K. et al. Seismicity associated with the 1991–1995 dome growth at Unzen Volcano, Japan. J. Volcanol. Geotherm. Res. 175 , 91–99 (2008).
Stasiuk, M. V., Jaupart, C. & Sparks, R. S. J. On the variations of flow rate in non-explosive lava eruptions. Earth Planet. Sci. Lett. 114 , 505–516 (1993).
Ebmeier, S. K., Biggs, J., Mather, T. A. & Amelung, F. On the lack of InSAR observations of magmatic deformation at Central American volcanoes. J. Geophys. Res.: Solid Earth 118 , 2571–2585 (2013).
Gottsmann, J. & Odbert, H. The effects of thermomechanical heterogeneities in island arc crust on time-dependent preeruptive stresses and the failure of an andesitic reservoir. J. Geophys. Res.: Solid Earth 119 , 4626–4639 (2014).
Command, U. S. Tradewinds 2019, https://www.southcom.mil/Media/Special-Coverage/Tradewinds-2019/ (2019).
Gansecki, C. et al. The tangled tale of Kilauea’s 2018 eruption eruption as told by geochemical monitoring. Science 366 , eaaz0147 (2019).
Article CAS PubMed Google Scholar
Beauducel, F., Nandaka, M. A., Cornet, F. & Diament, M. Mechanical discontinuities monitoring at Merapi volcano using kinematic GPS. J. Volcanol. Geotherm. Res. 150 , 300–312 (2006).
Deligne, N. I., Jolly, G. E., Taig, T. & Webb, T. H. Evaluating life-safety risk for fieldwork on active volcanoes: the volcano life risk estimator (VoLREst), a volcano observatory’s decision-support tool. J. Appl. Volcanol. 7 , 1–19 (2018).
Andreastuti, S. et al. Character of community response to volcanic crises at Sinabung and Kelud volcanoes. J. Volcanol. Geotherm. Res. 382 , 298–310 (2019).
Mothes, P. A. et al. The scientific–community interface over the fifteen-year eruptive episode of Tungurahua Volcano. Ecuad. J. Appl. Volcanol. 4 , 1–15 (2015).
Newhall, C. Professional conduct of scientists during volcanic crises. Bull. Volcanol. 60 , 323–334 (1999).
Jolly, G. The role of volcano observatories in risk reduction. In Global Volcanic Hazards and Risk (eds Loughlin, S. C., Sparks, S., Brown, S. K., Jenkins, S. A. & Vye-Brown, C.). 299–304 (Cambridge University Press, 2015). https://doi.org/10.1017/CBO9781316276273.017 .
Aspinall, W. & Woo, G. Counterfactual analysis of runaway volcanic explosions. Front. Earth Sci. 7 , 222 (2019).
Lesage, P., Heap, M. J. & Kushnir, A. A generic model for the shallow velocity structure of volcanoes. J. Volcanol. Geotherm. Res. 356 , 114–126 (2018).
Herring, T. A., King, R. W., Floyd, M. A. & McClusky, S. C. Introduction to GAMIT/GLOBK (Massachusetts Institute of Technology, 2018).
Ryan, G. A., Hamling, I. J., Pascal, K. & Camejo, M. Monitoring Volcano-deformation in the Eastern Caribbean Combining the Existing Gps Network and ALOS/ALOS-2 Data (The University of the West Indies Seismic Research Centre, Trinidad and Tobago, 2021).
Wegmuller, U. et al. Sentinel-1 support in the GAMMA Software. FRINGE 2015. 731 , 33 (2015).
Doin, M-P. et al. Presentation of the small baseline NSBAS processing chain on a case example: the Etna deformation monitoring from 2003 to 2010 using Envisat data. In Fringe 2011 Workshop (2011).
Grandin, R. Interferometric Processing of SLC Sentinel-1 TOPS Data. In Fringe 2015: Advances in the Science and Applications of SAR Interferometry and Sentinel-1 InSAR Workshop (2015).
Rosen, P. A., Hensley, S., Peltzer, G. & Simons, M. Updated repeat orbit interferometry package released. EOS, Trans., Am. Geophys. Union 85 , 47 (2004).
Jolivet, R., Grandin, R., Lasserre, C., Doin, M-.P. & Peltzer, G. Systematic InSAR tropospheric phase delay corrections from global meteorological reanalysis data. Geophys. Res. Lett. 38 , 1–6 (2011).
Allard, P. et al. Steam and gas emission rate from La Soufriere volcano, Guadeloupe (Lesser Antilles): implications for the magmatic supply during degassing unrest. Chem. Geol. 384 , 76–93 (2014).
Tamburello, G. Ratiocalc: Software for processing data from multicomponent volcanic gas analyzers. Computers Geosci. 82 , 63–67 (2015).
Download references
Acknowledgements
For their support to the monitoring of the eruption of La Soufrière, the staff of the SRC and MVO are thanked. Roderick Stewart is thanked for his service as a Scientific Team Lead in St. Vincent. We thank the Director and staff of NEMO, the SMU, Lands and Surveys Department of St. Vincent and volunteers assisting with field work for campaign EDM and GPS occupations. Willy Aspinall is thanked for sharing his insights and expertise throughout the unrest and eruption episode. We thank the ESA and JAXA for tasking systematic Sentinel-1 and ALOS-2 acquisitions over La Soufrière. We thank the Capella Space and ICEYE companies for providing high-resolution SAR images of the volcano during the explosive phase. ALOS-2 SAR data were made available by the Japanese Aerospace Exploration Agency (JAXA) for the sixth RA proposal (PI no. 3153). Collaborating agencies such as NASA, IPGP, LOA, AERIS/ICARE, CSIC, USGS VDAP, USAID, CIMH, KNMI, CEOS Volcano Demonstrator all provided support for remote sensing data analysis. We thank the MOUNTS platform for their automated analyses of Sentinel data for La Soufrière, SVG. Fieldwork for JB and PC and petrological analysis was supported by NERC Urgency Grant NE/W000725/1 and Royal Society Apex Award APX\R1\180094. We thank David Pyle, Gregor Weber and Jon Blundy for assisting with geochemical analysis of dome samples. Funding for the VRCP project was granted to RR (Grant No. GA 43/STV) through CDB’s Community Disaster Risk Reduction Fund (CDRRF) and is supported by the Government of Canada and the European Union. We also thank the Executive Director and staff of CDEMA for logistical support and resource mobilisation efforts.
Author information
Authors and affiliations.
Seismic Research Centre, The University of the West Indies, St. Augustine, Trinidad and Tobago
E. P. Joseph, M. Camejo-Harry, T. Christopher, R. Contreras-Arratia, S. Edwards, O. Graham, M. Johnson, A. Juman, J. L. Latchman, L. Lynch, V. L. Miller, I. Papadopoulos, K. Pascal, R. Robertson, G. A. Ryan & A. Stinton
Department of Earth Science, University of Oxford, Oxford, OX1 3AN, UK
M. Camejo-Harry
Montserrat Volcano Observatory, Flemmings, Montserrat
T. Christopher, V. L. Miller, K. Pascal, G. A. Ryan & A. Stinton
Université de Paris, Institut de Physique du Globe de Paris, CNRS, F-75005, Paris, France
GNS Science, Lower Hutt, New Zealand
USRA, NASA-GSFC, Greenbelt, MD, USA
School of Environmental Sciences, University of East Anglia, Norwich, UK
J. Barclay & B. V. Davies
School of Geography, Earth and Environmental Sciences, Plymouth University, Drake Circus, Plymouth, UK
School of Earth Sciences, University of Bristol, Bristol, BS8 1 R J, UK
R. S. J. Sparks
You can also search for this author in PubMed Google Scholar
Contributions
E.P.J. took the lead in writing the manuscript and oversaw the overall management of the UWI SRC during the volcanic crisis. M.C-.H., T.C., A.S., R.R., J.B., L.L. and P.C. conducted fieldwork, collected data, performed analysis and contributed to the interpretation of results. V.L.M. collected data, performed analysis and contributed to the interpretation of the results. K.P., G.R., J.L.L., R.C-.A., M.J. and I.P. analysed data and contributed to the interpretation of the results. S.E., O.G. and A.J. contributed to the design and implementation of the outreach research. R.G., I.H. and M-.J.J. analysed data and contributed to the interpretation of the results. J.B., P.C. and B.V.D. analysed the dome rock and eruptive products and contributed to the interpretation of the results. R.S.J.S. contributed to the development of a working conceptual model of the volcano. All authors provided feedback and helped shape the research, analysis and manuscript.
Corresponding author
Correspondence to E. P. Joseph .
Ethics declarations
Competing interests.
The authors declare no competing interests.
Peer review
Peer review information.
Nature Communications thanks Jan Lindsay, Matthew Patrick and the anonymous reviewer(s) for their contribution to the peer review of this work. Peer reviewer reports are available.
Additional information
Publisher’s note Springer Nature remains neutral with regard to jurisdictional claims in published maps and institutional affiliations.
Supplementary information
Supplementary information, peer review file, rights and permissions.
Open Access This article is licensed under a Creative Commons Attribution 4.0 International License, which permits use, sharing, adaptation, distribution and reproduction in any medium or format, as long as you give appropriate credit to the original author(s) and the source, provide a link to the Creative Commons license, and indicate if changes were made. The images or other third party material in this article are included in the article’s Creative Commons license, unless indicated otherwise in a credit line to the material. If material is not included in the article’s Creative Commons license and your intended use is not permitted by statutory regulation or exceeds the permitted use, you will need to obtain permission directly from the copyright holder. To view a copy of this license, visit http://creativecommons.org/licenses/by/4.0/ .
Reprints and permissions
About this article
Cite this article.
Joseph, E.P., Camejo-Harry, M., Christopher, T. et al. Responding to eruptive transitions during the 2020–2021 eruption of La Soufrière volcano, St. Vincent. Nat Commun 13 , 4129 (2022). https://doi.org/10.1038/s41467-022-31901-4
Download citation
Received : 28 July 2021
Accepted : 08 July 2022
Published : 15 July 2022
DOI : https://doi.org/10.1038/s41467-022-31901-4
Share this article
Anyone you share the following link with will be able to read this content:
Sorry, a shareable link is not currently available for this article.
Provided by the Springer Nature SharedIt content-sharing initiative
This article is cited by
Developing the future vision for seamless multi-hazard warnings for volcanic eruptions—outcomes from a workshop at iavcei 2023, rotorua.
Bulletin of Volcanology (2024)
Eruption style transition during the 2017–2018 eruptive activity at the Shinmoedake volcano, Kirishima, Japan: surface phenomena and eruptive products
- Fukashi Maeno
- Sayaka Shohata
- Setsuya Nakada
Earth, Planets and Space (2023)
Towards scientific forecasting of magmatic eruptions
- Valerio Acocella
- Maurizio Ripepe
- Erouscilla Joseph
Nature Reviews Earth & Environment (2023)
By submitting a comment you agree to abide by our Terms and Community Guidelines . If you find something abusive or that does not comply with our terms or guidelines please flag it as inappropriate.
Quick links
- Explore articles by subject
- Guide to authors
- Editorial policies
Sign up for the Nature Briefing: Anthropocene newsletter — what matters in anthropocene research, free to your inbox weekly.

Volcano World
- Central Andes (Under Construction)
- Hawaiian Volcanism
- Mount Saint Helens
- Volcanoes of Japan
- Extraterrestrial Volcanoes
- Teaching Resources
- Mount St Helens Living Lab
- Plate Tectonics
- Rocks and Minerals
- Prehistoric Earth
- Types of Volcanoes
- Eruption Styles
- Submarine Volcanoes
- Columnar Jointing
- Hydrovolcanism
- Volcanogenic Tsunamis
- Volcanic Minerals
- Volcanic Gases
- Volcanic Lightning
- Volcanic Sounds
- Volcanic Hazards
- GVP Current Eruption Reports
- US Volcano Activity Map
- Volcano Factoids
- Building Volcano Models
- Interviews with Volcanologists
- Working on Volcanoes
- Art Gallery
- Volcano Games
- Mount St. Helens by Helicopter
- Virtual Altiplano
- Virtual Altiplano Bolivia
- Around Santorini
- Climbing Mt Asama
- Driving Kilauea Rim Drive
- Exploring the Canary Islands
- Hiking Mount Ijen
- To the Top of Beerenberg
- Volcano Folklore
- Volcanic Parks
- Volcano Gallery
You are here
Case studies.
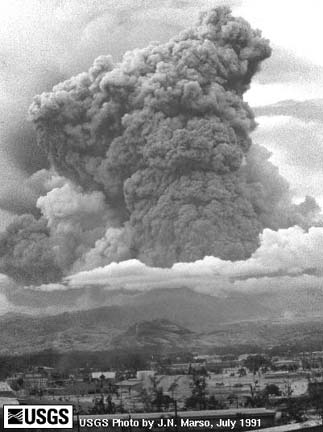
Left: Mt. Pinatubo eruption plume, July 1991, from Clark Air Base control tower. Photo by J.N. Marso, U.S. Geological Survey.
The effects of several historic eruptions have been observed and the impacts of larger, prehistoric eruptions can be estimated.
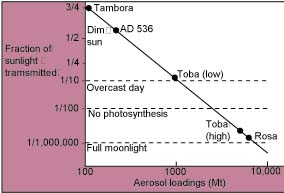
Estimates of the fraction of sunlight transmitted through stratigraphic aerosols after major eruptions. Roza refers to a flood basalt eruption in the northwestern United States. Graph from Rampino and others (1988).
The pages in this section explore the following case studies for their impact on global climate
Impact of some major historic eruptions.
| Eruption | VEI (Explosivity Index) | Magma Volume (km3) | Column height (km) | H2SO4 aerosols (kg) | Northern Hemisphere temperature decrease |
| Laki, 1783 | 4 | 14-15 | <1 x10 | about 1.0 | |
| Tambora, 1815 | 7 | >50 | >40 | 2x10 | 0.4-0.7 |
| Krakatau, 1883 | 6 | >10 | >40 | 5x10 | 0.3 |
| Santa Maria, 1902 | 6 | about 9 | >30 | <2x10 | 0.4 |
| Katmai, 1912 | 6 | 15 | >27 | <2x10 | 0.2 |
| St.Helens, 1980 | 5 | 0.35 | 22 | 3x10 | 0-0.1 |
| Agung, 1963 | 4 | 0.3-0.6 | 18 | 1-2x10 | 0.3 |
| El Chichon, 1982 | 4 | 0.3-0.35 | 26 | 1-2x10 | 0.4-0.6 |
Data from Rampino and Self, 1984.
- Mt. Pinatubo, Philippines - 1991
- El Chichon, Mexico - 1982
- Krakatau - 1883
- Tambora, Indonesia, 1815
- Laki, Iceland - 1783
- Toba, Indonesia, 75,000 years ago
Contact Info
VW is a higher education, k-12, and public outreach project of the Oregon Space Grant Consortium administered through the Department of Geosciences at Oregon State University.
Disclaimers and Policies | Login
- Share full article
Advertisement
Supported by
When Kilauea Erupted, a New Volcanic Playbook Was Written
Scientists learned lessons from the 2018 outburst on the island of Hawaii that are changing how responders prepare for eruptions in other places.

By Robin George Andrews
Back in the summer of 2018, Wendy Stovall stood and stared into the heart of an inferno.
Hawaii’s Kilauea volcano had been continuously erupting in one form or another since 1983. But from May to August, the volcano produced its magnum opus , unleashing 320,000 Olympic-size swimming pools’ worth of molten rock from its eastern flank.
Dr. Stovall, the deputy scientist-in-charge at the U.S. Geological Survey’s Yellowstone Volcano Observatory , recalls moments of being awe-struck by the eruption’s incandescence: lava fountains roaring like jet engines, painting the inky blue sky in crimson hues. But these briefly exhilarating moments were overwhelmed by sadness. The people of Hawaii would suffer hundreds of millions of dollars in economic damage. The lava bulldozed around 700 homes. Thousands of lives were upended. Even the headquarters of the Hawaiian Volcano Observatory itself, sitting atop the volcano , was torn apart by earthquakes early in the crisis.
Like many volcanologists who were there during the eruption, Dr. Stovall is still processing the trauma she witnessed. Sadness is not quite the right word to describe what she feels, she said: “Maybe it’s an emotion that I don’t even have a word for.”
But not only trauma has resulted from the crisis: It has also produced something of a sea change in the way scientists and their emergency services partners are able to respond to volcanic emergencies.
During Kilauea’s devastating outburst, responders found novel ways to deploy drones and used social media to help those in the lava’s path. They also achieved more ineffable insights into how to keep cool in the face of hot lava. And this pandemonium of pedagogical experiences will prove valuable in times to come. The United States is home to 161 active or potentially active volcanoes — approximately 10 percent of the world’s total. When — not if — a Kilauean-esque outburst or something more explosive takes place near an American city, scientists and emergency responders will be better prepared than ever to confront and counter that volcanic conflagration.
A Patchwork of Fire

We are having trouble retrieving the article content.
Please enable JavaScript in your browser settings.
Thank you for your patience while we verify access. If you are in Reader mode please exit and log into your Times account, or subscribe for all of The Times.
Thank you for your patience while we verify access.
Already a subscriber? Log in .
Want all of The Times? Subscribe .
Case Study: Volcanoes ( SL IB Geography )
Revision note.

Geography Lead
Case Study: Mount Merapi
Mount merapi earthquake facts.
- Name – Mount Merapi
- Location – Java, Indonesia
- Date – 25th October–30th November 2010
- Magnitude – VEI 4
- Plate boundary – Destructive plate boundary where the Indo-Australian plate is subducting below the Eurasian plate
- Type of volcano – Stratovolcano or composite
Location of Mount Merapi

Impacts of the 2010 Eruption of Mount Merapi, Indonesia
|
| Primary impacts | Secondary impacts |
| Social | 353 deaths Injuries and illness e.g. sulphur dioxide gas caused skin irritation and breathing problems Damage to over 19,000 homes and properties Displacement of 350,000 people | Nearly half of the people affected by the eruption suffered mental health issues e.g. stress, anxiety, depression Disruption to services such as healthcare and education Disruption to religious and traditional practices |
| Economic | Economic losses of £450 million due mainly to impact on farming, tourism and manufacturing Destruction of property and infrastructure e.g. 30 bridges were damaged Disruption of trade and economic activity e.g. about 2500 flights cancelled | Food prices increased due to destruction of crops and livestock Slower economic growth and development due to closure or relocation of businesses, decline in tourism, damage to crops etc. Tourism fell by 30% (domestic tourists) and 70% (international tourists) |
| Environmental | Destruction of biodiversity, habitats and ecosystems e.g. over 200 hectares of forest were damaged Poor air and water quality | Acid rain damaged ecosystems Long-term pollution of land and rivers |
| Political | Pressure on government to co-ordinate emergency response Social unrest, looting and political instability | Conflicts over government response and food shortages e.g. some residents claimed that the compensation scheme was inadequate and unfair |
Factors affecting vulnerability
- The number of deaths, injuries and displacement of population was high during and after the eruption
- People were vulnerable to the impacts of the hazard
- People refused to leave their homes, which made them more vulnerable to the impacts of the eruption
- Caring responsibilities for elderly parents
- Responsibilities for livestock
- Long-term residency and a subsequent unwillingness to leave
- Cultural beliefs
- Population density in the area has increased
- Local people don't always believe that scientific monitoring is accurate, relying instead on traditional warning signs
- Communication regarding the dangers of the eruption was slow and ineffective
Case Study: Cumbre Vieja
La palma, spain.
- Part of the Canary Islands, La Palma is located in the Atlantic Ocean off the coast of North Africa
- The Canary Islands are an [popover id="RAr2r~3MbVY7biGB" label=''autonomous region"] of Spain
- There are 33 volcanoes across the Canary Islands, 10 of which are in La Palma
Cumbre Viejo earthquake facts
- Name – Cumbre Viejo
- Location – La Palma, Spain
- Date – 19th September–December 2021
- Magnitude – VEI 2 or 3
- Plate boundary – Magma plume (hotspot)
- Type of volcano – Cinder cone (basaltic lava)
Location of Cumbre Vieja Volcano

Primary impacts
- Almost 1500 houses were destroyed by the lava flow
- Over 1500 other buildings such as churches, shops and schools were destroyed
- The lava flow cut across the coastal highway and covered 1000 hectares
- The water supply was cut off for almost 3000 people
- 400 hectares of banana farms were destroyed
- Almost 1300 hectares of land were affected
- There was one death
Secondary impacts
- Air traffic was suspended on a number of occasions due to ash in the atmosphere
- Over 1000 people were evacuated after the eruption began on the 19th September
- A further 5600 people were evacuated over the next few weeks
- About 20,000 people were exposed to the eruption and its effects
- Evacuation plans
- Suspension of air traffic
- La Palma also has a Local Hazard Mitigation Plan , which aims to reduce the impacts of any hazard event
- People are encouraged to have an emergency kit ready in case of eruptions
- Insurance cover means that recovery from a hazard event is more rapid
- La Palma has well-trained and equipped emergency services
You've read 0 of your 10 free revision notes
Get unlimited access.
to absolutely everything:
- Downloadable PDFs
- Unlimited Revision Notes
- Topic Questions
- Past Papers
- Model Answers
- Videos (Maths and Science)
Join the 100,000 + Students that ❤️ Save My Exams
the (exam) results speak for themselves:
Did this page help you?
Author: Bridgette
After graduating with a degree in Geography, Bridgette completed a PGCE over 25 years ago. She later gained an MA Learning, Technology and Education from the University of Nottingham focussing on online learning. At a time when the study of geography has never been more important, Bridgette is passionate about creating content which supports students in achieving their potential in geography and builds their confidence.
- 0 Shopping Cart

Eyjafjallajokull Case Study
What is Eyjafjallajokull?
Eyjafjallajokull is a volcano located in Iceland. The name is a description of the volcano with Eyja meaning island; fjalla meaning mountain; and jokull meaning glacier. You can find out how to pronounce Eyjafjallajokull on the BBC website .
Eyjafjallajökull consists of a volcano completely covered by an ice cap. The ice cap covers an area of about 100 square kilometres (39 sq mi), feeding many outlet glaciers.
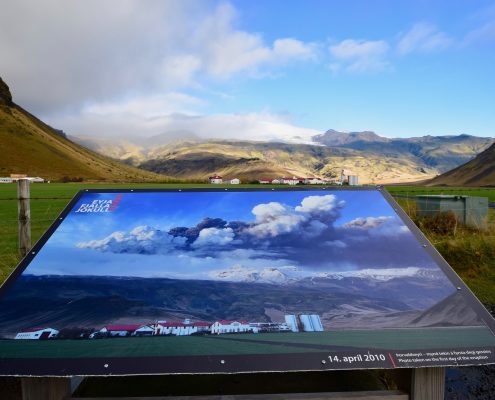
What type of volcano is Eyjafjallajokull?
The mountain itself, a composite (stratovolcano) volcano, stands 1,651 metres (5,417 ft) at its highest point and has a crater 3–4 kilometres (1.9–2.5 mi) in diameter, open to the north.
When did Eyjafjallajokull erupt?
Eyjafjallajokull erupted between March and May 2010.
Why did Eyjafjallajokull erupt?
Iceland lies on the Mid-Atlantic Ridge, a constructive plate margin separating the North American and Eurasian plates. The two plates move apart due to ridge push along the Mid-Atlantic Ridge. As the plates move apart, magma fills the magma chamber below Eyjafjallajokull—several magma chambers combined to produce a significant volume of magma below the volcano. Eyjafjallajokull is located below a glacier.
The Eyjafjallajökull volcano erupted in 920, 1612 and again from 1821 to 1823 when it caused a glacial lake outburst flood (or jökulhlaup). It erupted three times in 2010—on 20 March, April–May, and June. The March event forced a brief evacuation of around 500 local people. Still, the 14 April eruption was ten to twenty times more powerful and caused substantial disruption to air traffic across Europe. It caused the cancellation of thousands of flights across Europe and to Iceland.
How big was the eruption of Eyjafjallajokull?
The eruption was only three on the volcanic explosivity index (VEI). Around 15 eruptions on this scale usually happen each year in Iceland. However, in this case, a combination of a settled weather pattern with winds blowing towards Europe, very fine ash and a persistent eruption lasting 39 days magnified the impact of a relatively ordinary event. The eruptions in March were mainly lava eruptions. On 14 April, a new phase began, which was much more explosive. Violent eruptions belched huge quantities of ash into the atmosphere.
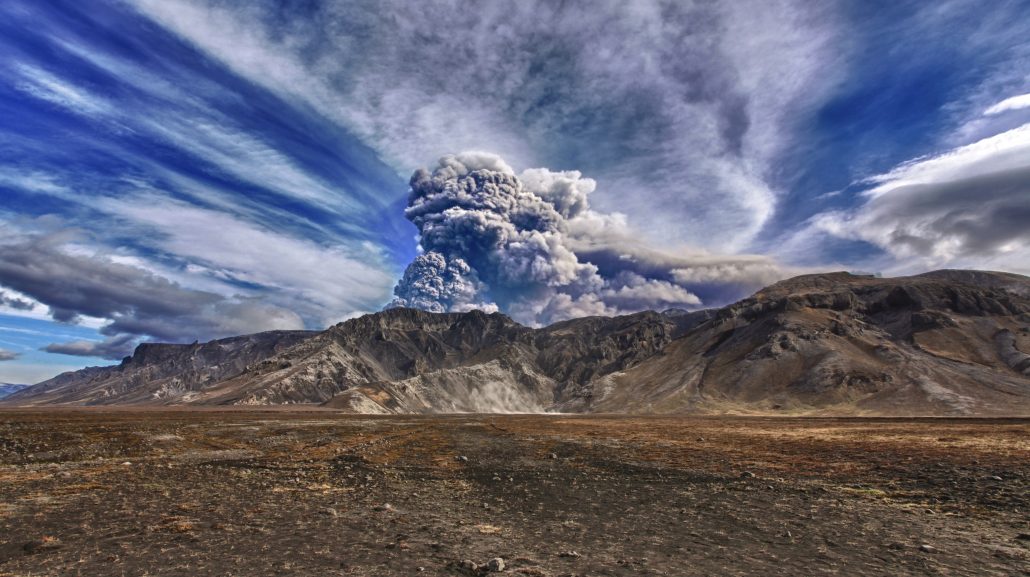
The eruption of Eyjafjallajokull
What were the impacts of the eruption? (social / economic / environmental – primary and secondary effects)
Primary effects : As a result of the eruption, day turned to night, with the ash blocking the sun. Rescuers wore face masks to prevent them from choking on ash clouds.
Homes and roads were damaged, services were disrupted, crops were destroyed by ash, and roads were washed away. The ash cloud brought European airspace to a standstill during the latter half of April 2010 and cost billions of euros in delays. During the eruption, a no-fly zone was imposed across much of Europe, meaning airlines lost around £130m per day. The price of shares in major airlines dropped between 2.5 and 3.3% during the eruption. However, it should be noted that imports and exports are being impacted across European countries on the trade front, so the net trade position was not affected markedly overall.
Secondary effects : Sporting events were cancelled or affected due to cancelled flights. Fresh food imports stopped, and industries were affected by a lack of imported raw materials. Local water supplies were contaminated with fluoride. Flooding was caused as the glacier melted.
International Effects: The impact was felt as far afield as Kenya, where farmers have laid off 5000 workers after flowers and vegetables were left rotting at airports. Kenya’s flower council says the country lost $1.3m a day in lost shipments to Europe. Kenya exports typically up to 500 tonnes of flowers daily – 97% of which is delivered to Europe. Horticulture earned Kenya 71 billion shillings (£594m) in 2009 and is the country’s top foreign exchange earner. You can read more about this on the Guardian website .
What opportunities did the eruption of Eyjafjallajokull bring?
Despite the problems caused by the eruption of Eyjafjallajokull, the eruption brought several benefits. According to the Environmental Transport Association, the grounding of European flights prevented some 2.8 million tonnes of carbon dioxide into the atmosphere (according to the Environmental Transport Association).
As passengers looked for other ways to travel than flying, many different transport companies benefited. There was a considerable increase in passenger numbers on Eurostar. It saw a rise of nearly a third, with 50,000 extra passengers travelling on their trains.
Ash from the Eyjafjallajökull volcano deposited dissolved iron into the North Atlantic, triggering a plankton bloom, driving an increase in biological productivity.
Following the negative publicity of the eruption, the Icelandic government launched a campaign to promote tourism . Inspired by Iceland was established with the strategic intent of depicting the country’s beauty, the friendliness of its people and the fact that it was very much open for business. As a result, tourist numbers increased significantly following the campaign, as shown in the graph below.
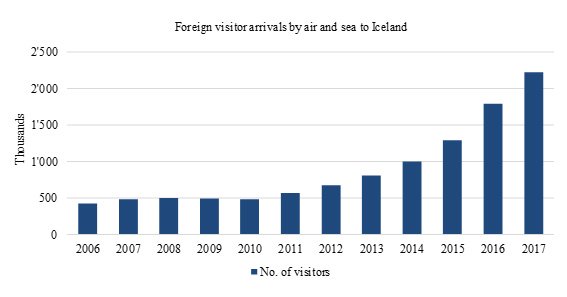
Foreign visitor arrivals to Iceland
What was done to reduce the impact of the eruption of Eyjafjallajokull?
In the short term, the area around the volcano was evacuated.
European Red Cross Societies mobilised volunteers, staff and other resources to help people affected directly or indirectly by the eruption of the Eyjafjallajökull glacier volcano. The European Red Cross provided food for the farming population living in the vicinity of the glacier, as well as counselling and psychosocial support, in particular for traumatised children. Some 700 people were evacuated from the disaster zone three times in the past month. In one instance, people had to flee their homes in the middle of the night to escape from flash floods.
The European Union has developed an integrated structure for air traffic management. As a result, nine Functional Airspace Blocks (FABs) will replace the existing 27 areas. This means following a volcanic eruption in the future, areas of air space may be closed, reducing the risk of closing all European air space.

Premium Resources
Please support internet geography.
If you've found the resources on this page useful please consider making a secure donation via PayPal to support the development of the site. The site is self-funded and your support is really appreciated.
Related Topics
Use the images below to explore related GeoTopics.
Previous Topic Page
Topic home, sunda strait tsunami indonesia case study 2018, iconbox title.
Click to add your own text here
Share this:
- Click to share on Twitter (Opens in new window)
- Click to share on Facebook (Opens in new window)
- Click to share on Pinterest (Opens in new window)
- Click to email a link to a friend (Opens in new window)
- Click to share on WhatsApp (Opens in new window)
- Click to print (Opens in new window)
If you've found the resources on this site useful please consider making a secure donation via PayPal to support the development of the site. The site is self-funded and your support is really appreciated.
Search Internet Geography
Latest Blog Entries
Pin It on Pinterest
- Click to share
- Print Friendly
Case Studies Highlighting Impacts of Volcanic Ashfall, Gas & Vog
Case studies of past impacts and mitigation strategies for specific eruptions are given here. Sector specific information from these case studies also appear under their relevant topic headings (topics on the left).
Each case study begins with a brief overview discussing the size and volume of ash dispersed where known or approximated. Specific impact & mitigation information is organized into the following categories (where it is reported):
- Agriculture – Plants & Animals – includes livestock, pastoral land, horticulture and forestry.
- Health – direct and indirect from exposure.
- Infrastructure – may be summarised or some or all of the following are detailed depending on complexity
- Equipment & Communications
- Power supply
- Transportation
- Water & Wastewater
- Cleanup & Disposal
- Remobilization and coping with long-term ash – includes water and wind remobilised ash.
- Eyewitness &ndash Accounts from eruptions where available.
- Emergency management – monitoring, response during the eruption and recovery post eruption.
Please contact the Ash Web Team if you would like to contribute additional case study information. We are always looking for additional information.

An ash cloud rises over the lake as Taal Volcano erupts in the Philippines on January 12. The ongoing eruption is blanketing the region with debris and has already spurred evacuations, school closings, and flight cancellations.
What the Philippines volcano ‘worst-case scenario’ could look like
With millions of people at risk, experts are looking to past big eruptions to better understand the unique hazards this peak can produce.
Normally, the view from the webcam sitting inside Lake Taal in the Philippines shows clouds drifting over the lake’s placid waters, as verdant slopes rise in the distance. But on the afternoon of January 12, this peaceful scene was suddenly interrupted by a torrent of hot ash and gas, before the camera was smothered by darkness.
The outpouring marked the beginning of an unnerving eruption sequence at Taal Volcano, which sits on the island of Luzon. On the first day, steam-driven blasts flung ash nine miles into the sky . Startling displays of volcanic lightning ricocheted around this dark maelstrom , and a myriad of intense volcanic earthquakes rocked the region. On January 13, the eruption became somewhat more magmatic, as lava fountains started shooting up from the main crater.
Ash continues to blanket the Philippines as of press time, including in the capital city of Manila , about 62 miles north of the volcano. Flights have been cancelled, schools and other public institutions have closed, and tens of thousands of people have been evacuated from both the volcanic isle within Lake Taal and from the vast shorelines around it.
So far, no casualties have been reported, and there is a chance this eruption could fizzle out. Still, many people likely remain in high-risk zones, and “the biggest bang is not always at the beginning of an eruption,” says Jenni Barclay , a volcanologist at the University of East Anglia. “On a timescale much longer than the threat of a hurricane, something else could happen that’s even bigger.”
Past eruptions at Taal demonstrate that this volcano has a profoundly lethal capability, claiming thousands of lives throughout recorded history. If the latest event does become more explosive—a possibility that has scientists deeply concerned—it could yield a surfeit of volcanic hazards, from rocky debris bouncing across the lake to overwhelming tsunamis.
“This is definitely a volcano to be taken seriously,” says Beth Bartel , an outreach specialist at UNAVCO , a geoscientific consortium of universities and scientific institutions.
Telling Taal tales
With a plentiful supply of magma, Taal is one of the Philippines’ most active volcanoes , having erupted dozens of times in the past few centuries. Some of those past eruptions rank among the most powerful in the country’s history. But Taal Volcano is visually deceptive.
Many of these historical eruptions took place on the volcanic island in the middle of the more expansive Lake Taal. However, the entire volcano is far larger than this rocky outpost; it is a giant cauldron-shaped edifice known as a caldera. Much of the caldera is hidden by Lake Taal, and only a small portion of the volcano sits above the waves.
This is a problem not only for those who live on the central volcanic isle, but also for the 25 million people living within 60 miles of the volcano, including a huge number on Lake Taal’s shorelines.
Due to the continuing intense volcanic earthquakes and eruptive activity, the Philippine Institute of Volcanology and Seismology, or PHIVOLCS , has set the alert level to four , meaning that a hazardous explosive eruption is possible within hours to days.
A link to the past
To understand what that might mean, experts can look to the past for hints. The most recent past eruption at Taal was a minor steam-driven event in 1977, notes Ed Venzke , the database manager at the Smithsonian Institution’s Global Volcanism Program.
While there may not have been an eruption for four decades, the volcano has “clearly been restless for a very long time,” says Amy Donovan , an expert in volcanic risk at the University of Cambridge. Although often moderate when compared to other volcanic eruptions, many of Taal’s paroxysms have been violently explosive and, due to the huge number of people living on or close to it, frequently fatal.
Greater ash production that often accompanies bigger booms will exacerbate matters. Ash can pollute water supplies, damage electronic infrastructure, smother agriculture, and kill off farm animals and pets . It can also kill people if they inhale enough of it; breathing in glassy ash is always bad, but people with pre-existing respiratory ailments are most at risk, as are the very young and the elderly.
You May Also Like

A rare and puzzling ‘domino effect’ triggered 4 powerful quakes in Afghanistan

Earth is a geological oddball in our solar system. This is why.

This African lake may literally explode—and millions are at risk
Either through explosive mixing of magma and water, or through magmatic activity alone, Taal has also previously produced thundering, high-velocity clouds of hot ash, debris, and gas named pyroclastic flows that have killed thousands of people in mere moments. Boris Behncke , a volcanologist at Italy’s National Institute of Geophysics and Volcanology, shared some examples on Twitter , including flows from a 1911 eruption that killed 1,335 people on the central island.
A reasonable worst-case scenario would not just feature pyroclastic flows, but also low-altitude surges of ash and scorching gas that, due to their low density, can literally bounce over the water , says Donovan. These base surges—a term borrowed from nuclear explosion science—“can sandblast everything in their path, including the lake shore on the other side,” Bartel says.
What’s more, if explosions dislodge parts of the volcanic island that then fall into Lake Taal, that could generate tsunamis that will swamp the lake’s shorelines. As an eruption at Indonesia’s Anak Krakatau showed in December 2018 , it only takes a small volcanic collapse to generate a lethal tsunami.
Even if there is no tsunami, falling debris and volcanic earthquakes can cause peculiar and potentially destructive waves known as seiches ; if that debris has enough energy, it can miss the lake entirely and instead land directly on shore.
Back to Taal's future
Of course, forecasting eruptions is fraught with difficulty . Donovan points out that we don’t know how the properties of the magma under Taal have changed since the 1977 eruption. And while looking to old eruptions for clues is helpful, the past can only tell you so much.
“Every eruption is different,” Venzke says. “There’s nothing guaranteed.”
It’s possible that this grim future may not transpire, and that we’ve seen the worst of what Taal has to offer this time, Donovan says: “It might just generate a bit of ash, have a few fire fountains, then go back to sleep again.”
Every eruption is different. There's nothing guaranteed. Ed Venzke , Smithsonian Institution Global Volcanism Program
Alternatively, what we are seeing here could perhaps be the opening salvo of a far longer eruption sequence, says James Hickey , a geophysical volcanologist at the University of Exeter. And even if the eruption becomes more explosive, some, all, or none of these hazards may occur.
Still, it is sensible for people in the region to assume the worst-case scenario is unfolding and to take reasonable, responsible action, Donovan says. If you are still around Taal and haven’t yet heeded instructions to evacuate , it's best to immediately get away from low-lying areas near the volcano. Always listen to local authorities for updates.
In the meantime, volcanologists will wait with bated breath, since lessons from the past show just how dangerous this particular peak can be.
“When I saw yesterday that Taal was in eruption,” Bartel says,” I was somewhat horrified.”
Related Topics
- VOLCANOLOGY
- NATURAL DISASTERS
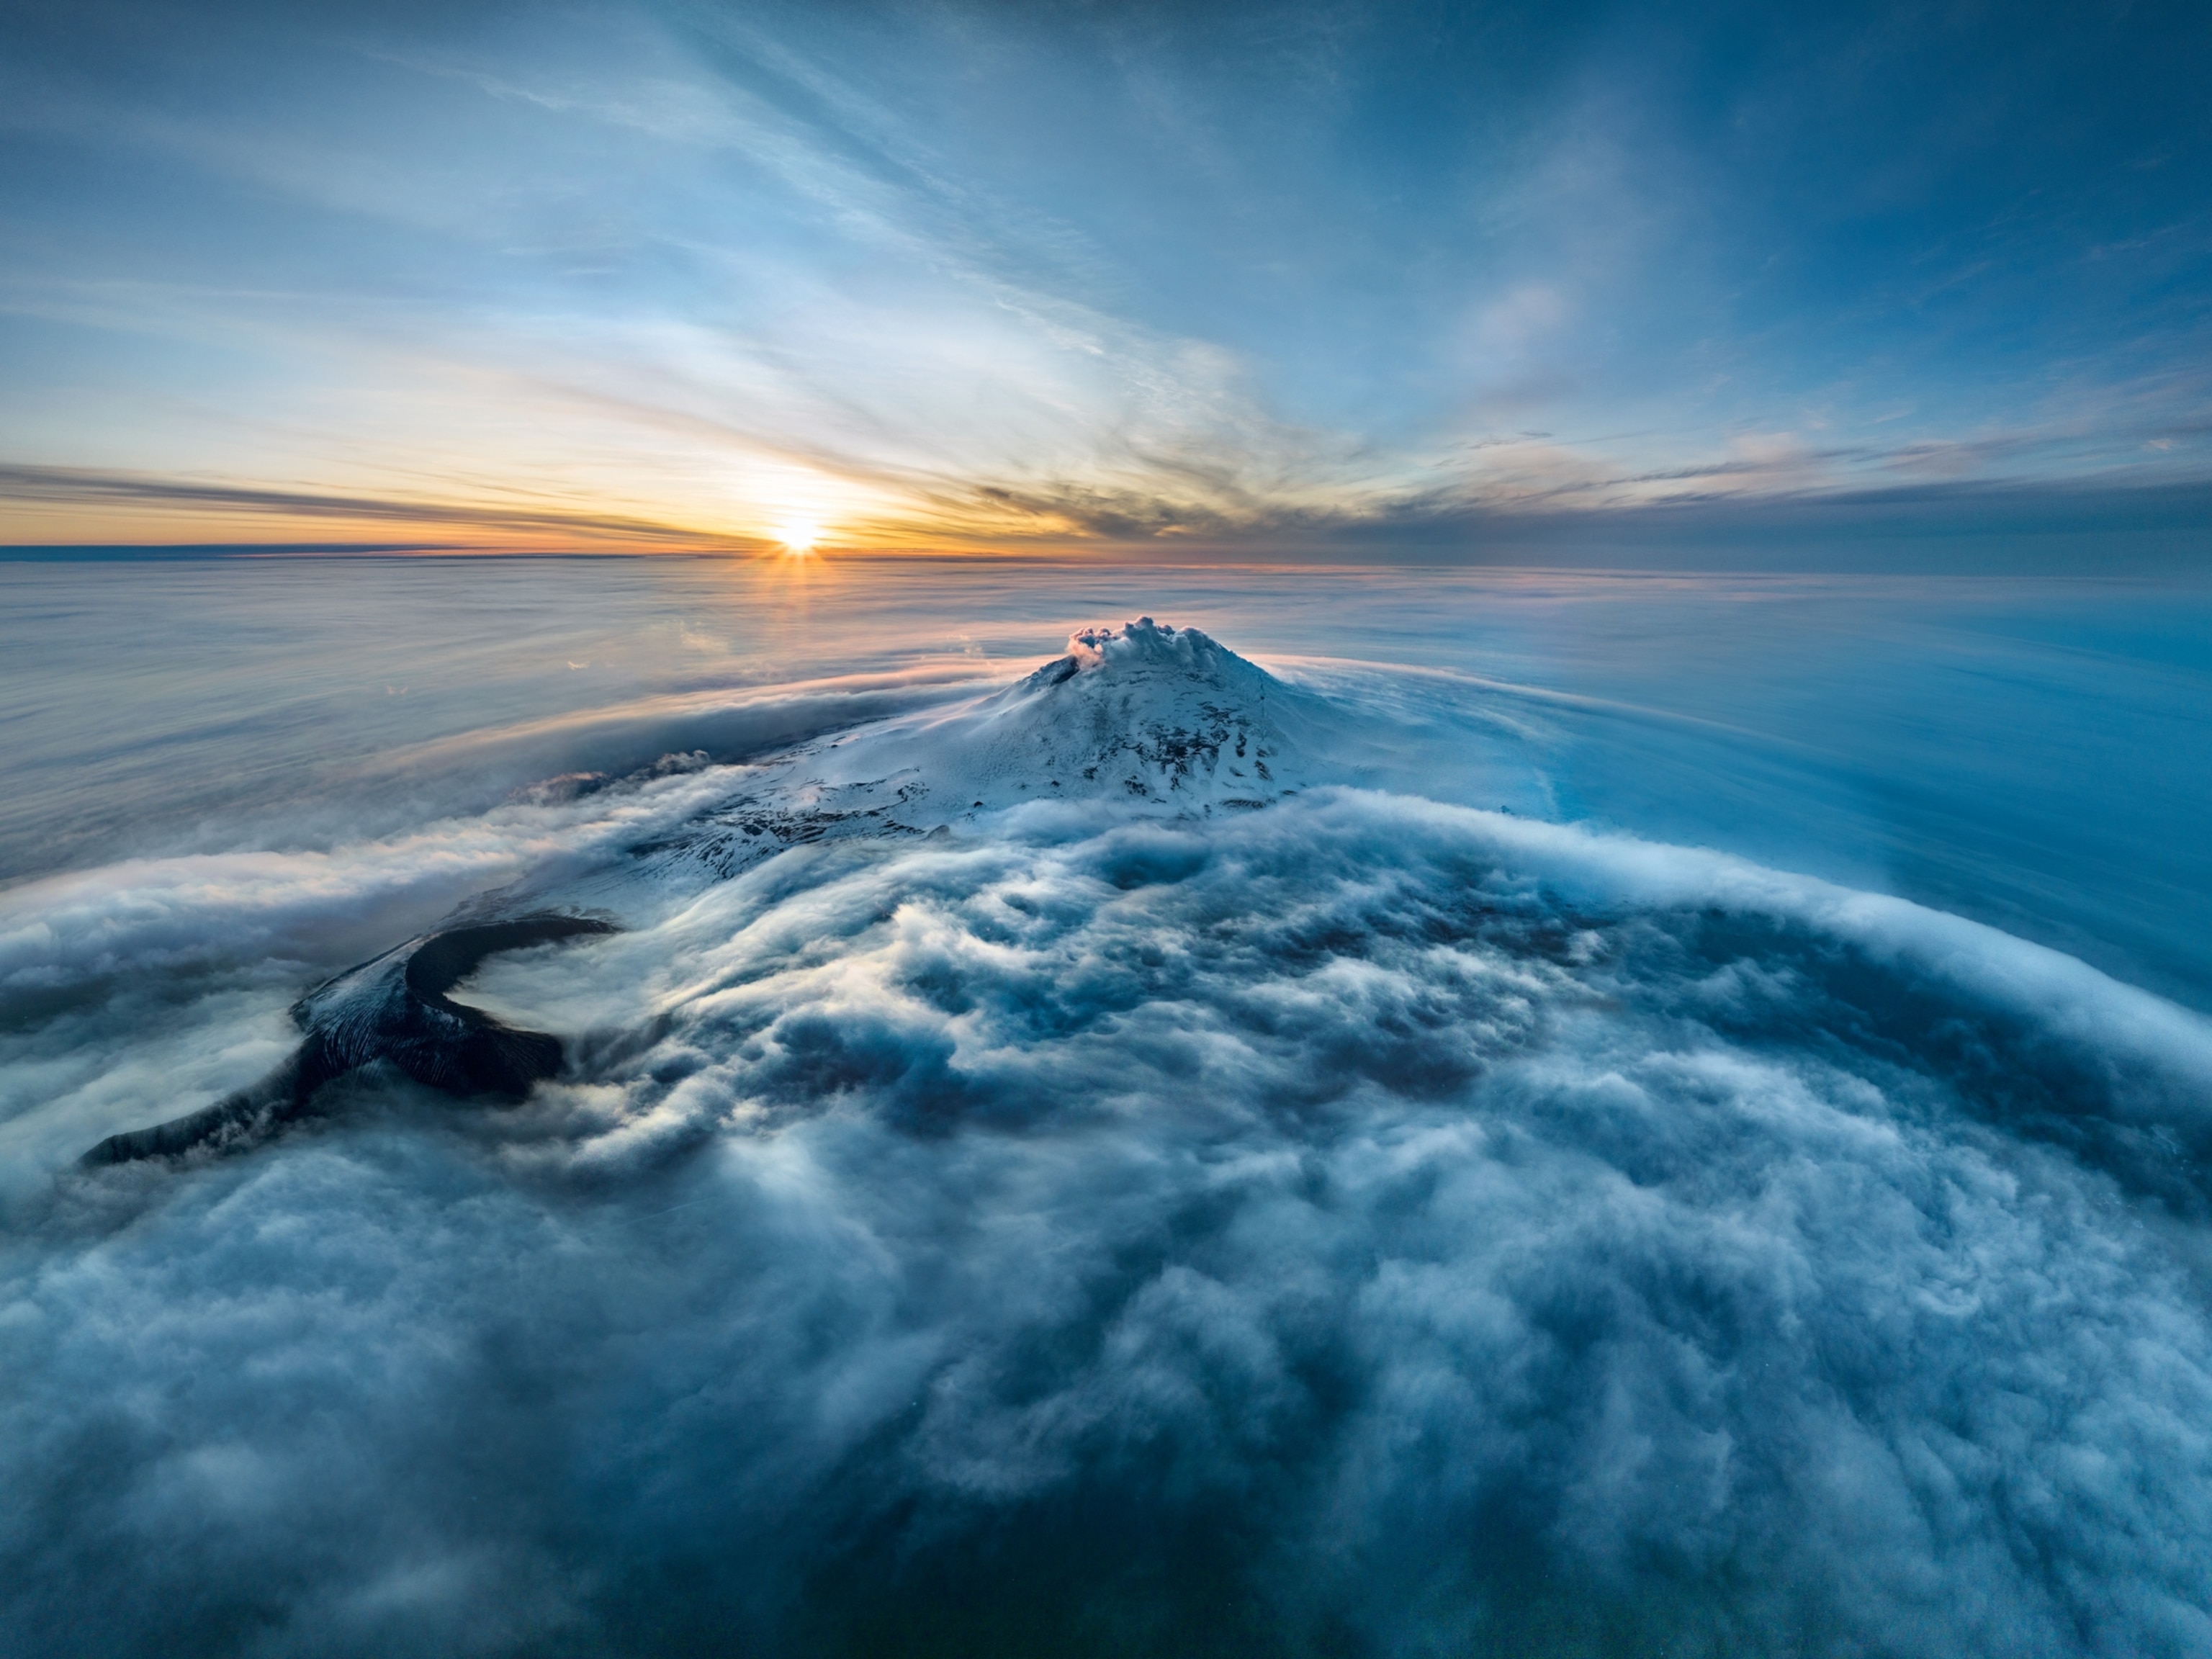
The world’s loneliest volcano may hold something truly rare. We went to find it.
Startling volcanic activity has town in Iceland bracing for crisis

Volcanoes blow smoke rings. Here's how they do it.
Extreme heat is the future. Here are 10 practical ways to manage it.
The island of Santorini is hiding an explosive secret
- Environment
- Paid Content
History & Culture
- History & Culture
- Terms of Use
- Privacy Policy
- Your US State Privacy Rights
- Children's Online Privacy Policy
- Interest-Based Ads
- About Nielsen Measurement
- Do Not Sell or Share My Personal Information
- Nat Geo Home
- Attend a Live Event
- Book a Trip
- Inspire Your Kids
- Shop Nat Geo
- Visit the D.C. Museum
- Learn About Our Impact
- Support Our Mission
- Advertise With Us
- Customer Service
- Renew Subscription
- Manage Your Subscription
- Work at Nat Geo
- Sign Up for Our Newsletters
- Contribute to Protect the Planet
Copyright © 1996-2015 National Geographic Society Copyright © 2015-2024 National Geographic Partners, LLC. All rights reserved

IMAGES
VIDEO
COMMENTS
Mount Etna is a volcano. The reasons why Mount Etna is located where it is are complex. Here are some of the theories: One theory envisages a hot spot or mantle-plume origin for this volcano, like those that produce the volcanoes in Hawaii. Another theory involves the subduction of the African plate under the Eurasian plate.
How Volcanoes Build Our World. How Volcanoes Build Our World. Volcanoes: A Case Study ...
The uninhabited island covers an area of approximately 325 ha (800 acres), which is only the peak of a much larger submarine volcano. White Island is privately owned. It was declared a private scenic reserve in 1953. Visitors cannot land without permission, however, it is accessible by authorised tourist operators by boat and helicopter.
Case Study 4: Rabaul Volcano, New Britain Island, Papua New Guinea 688-m high Rabaul is a violent volcano on the tip of the Gazelle Peninsula in Papua New Guinea. Its most prominent feature is a caldera, with hills of pyroclastic material around it (Rabaul is described as a pryoclastic shield). The town of Rabaul is located within the caldera.
The science of volcanology advances disproportionately during exceptionally large or well-observed eruptions. The 2018 eruption of Kīlauea Volcano (Hawai'i) was its most impactful in centuries, involving an outpouring of more than one cubic kilometer of basalt, a magnitude 7 flank earthquake, and the volcano's largest summit collapse since at least the nineteenth century.
earthquake activity, that is a shaking and vibration of the land surface, was recorded at Mt. St. Helens. Richter earthquake magnitudes varied from about 2.6 to 4.2. Between March 26 and March 27 over 174 earthquakes with magnitudes greater than 2.6 were recorded.
The elongated volcano dates back to about 125,000 years ago and is oriented N-S. Eruptions during the past 7,000 years have formed abundant cinder cones and craters along the axis, producing fissure-fed lava flows that descend steeply to the sea. Eruptions recorded since the 15th century have produced mild explosive activity and lava flows that ...
Investigations carried out as part of the USGS Volcano Hazards Program provide case studies of monitoring two of the world's most active and best understood volcanoes, Mauna Loa and Kilauea on the "Big Island" of Hawaii.Since 1980, the USGS has expanded its monitoring studies to include other volcanoes in the United States and, in cooperation with foreign scientists, in a few other countries.
2 Preparedness Ambassadors Case Studies Sequence of Mount St. Helens photos of the colossal landslide and ensuing lateral blast following the Mw 5.1 earthquake, 1980. Timestamps indicate the time following the earthquake. https://volcanoes.usgs.gov/volcanic_ ash/mount_st_helens_1980.html (accessed July 26, 2020) The Volcano Erupts
The May 2018 rift intrusion and eruption of Kīlauea Volcano, Hawai'i, represented one of its most extraordinary eruptive sequences in at least 200 years, yet the trigger mechanism remains elusive1.
The massive eruption of the Hunga Tonga-Hunga Ha'apai volcano this January in Tonga, in the south Pacific Ocean, was the volcanic equivalent of a 'near miss' asteroid whizzing by the Earth ...
The Hunga Tonga-Hunga Ha'apai (HTHH) volcano (20.536°S, 175.382°W) is an underwater caldera volcano located ~70 km north-northwest of Tonga's capital, Nukualofa. Recent Surtseyan-style eruptive activity was observed in 2009, from 2014 to 2015, and from 20 December 2021 to 15 January 2022 (17). In the lead-up to the 15 January 2022 ...
The St. Vincent case provides an important demonstration of how these principles were integrated, complementing synoptic analyses of the state-of-the-art in volcano observatory crisis operations 6 ...
Case Studies. Left: Mt. Pinatubo eruption plume, July 1991, from Clark Air Base control tower. Photo by J.N. Marso, U.S. Geological Survey. The effects of several historic eruptions have been observed and the impacts of larger, prehistoric eruptions can be estimated. Estimates of the fraction of sunlight transmitted through stratigraphic ...
By Robin George Andrews. Published Nov. 9, 2021 Updated Nov. 10, 2021. Back in the summer of 2018, Wendy Stovall stood and stared into the heart of an inferno. Hawaii's Kilauea volcano had been ...
Volcanoes case study 1 -Eyjafjallajökull. Tectonic setting of the hazard. The nature of the hazard (type, magnitude, frequency) Vulnerability. Capacity to cope (prediction, prevention, preparation) Institutional capacity. The impact of the event (social, economic, environmental), in the short and longer term.
At a time when the study of geography has never been more important, Bridgette is passionate about creating content which supports students in achieving their potential in geography and builds their confidence. Revision notes on 7.3.1 Case Study: Volcanoes for the SL IB Geography syllabus, written by the Geography experts at Save My Exams.
Eyjafjallajokull is located below a glacier. The Eyjafjallajökull volcano erupted in 920, 1612 and again from 1821 to 1823 when it caused a glacial lake outburst flood (or jökulhlaup). It erupted three times in 2010—on 20 March, April-May, and June. The March event forced a brief evacuation of around 500 local people.
Case studies of past impacts and mitigation strategies for specific eruptions are given here. Sector specific information from these case studies also appear under their relevant topic headings (topics on the left). Each case study begins with a brief overview discussing the size and volume of ash dispersed where known or approximated. Specific ...
Eventually the hotspot volcanoes become extinct, gradually subside, and are eroded by wave action. Over geologic time, these processes produce lines of islands, atolls, and seamounts known as hotspot tracks, or chains. The youngest, active volcanoes are located within a region of the plate that overlies the mantle plume.
What the Philippines volcano 'worst-case scenario' could look like. With millions of people at risk, experts are looking to past big eruptions to better understand the unique hazards this peak ...