

Progress Updates

Giving Progress Updates
A large part of scientific communication involves progress updates between you and your mentors, whether they be within your research lab, your PI or your graduate student/post-doc. These typically will occur weekly (sometimes less frequently depending on your lab dynamics) and may take on many different forms. Some labs have weekly lab meetings where only one individual presents their research. Some labs have additional 1 on 1 or group meetings to discuss progress from individuals or specific research projects. Some labs may only have verbal progress updates. In any case, it is important to practice your scientific communication skills in this setting, as it is unique from the other kinds of presentations you may be giving at conferences or in more formal settings.
Some important differences pertaining to progress updates include the following:
These should be more casual. These meetings are meant to examine your progress, but are mostly there to provide a space for you to get feedback/have questions answered.
Don’t be afraid to show EVERYTHING. This is a problem we see a lot. Many undergraduate students only want to show pristine data figures in progress updates, which normally means they end up not showing anything at all when something goes wrong. It is important to include shortcomings; data that is in progress but not necessarily completed, or interesting preliminary findings. In a conference presentation you will likely not show this, but it is important to discuss these topics now, to gain insight from others within your lab and to help keep you on the right track. Additionally, this will demonstrate to your advisors that you are putting in the work, despite the shortcomings you have encountered.
Know your audience. You will likely be presenting to your lab who likely have a strong background in your subject. Be selective on what you do and don’t address in terms of background.
So, you may be asking, “I need to have enough research completed to prepare a progress update EVERY WEEK??”. This definitely depends on your lab and research organization, but it is likely you will be presenting on your progress on a regular basis in some capacity. Fret not, remember a progress update is distinct from a research presentation. Everyone has slow weeks, whether it be you put in a lot of hours but things weren’t working or you just didn’t have as much time to work on your research. This is okay, it happens to everyone. However, there is an art in demonstrating your work despite shortcomings/lack of progress. For example, look at progress update examples “A” and “B” below.

These are updates from the same hypothetical amount of work done for the week. Progress update A does not reflect the amount of time you spent writing code and analyzing images. It also may be a red flag for your mentor as there is no evidence that you are progressing whatsoever. Update B on the other hand clearly demonstrates the code you are troubleshooting and the errors that have come with it. This will make it much easier for your mentor/lab to provide constructive feedback. Despite the fact that both of these reports were completed for the same amount of work in a “slow” week of progress, update B fully demonstrates the amount of work you put in and progress you made. To fully reap the benefits of constructive feedback from these regular progress meetings, it is important to not be afraid to be transparent and show all of your work.
Poster Design

Poster Presentations

Research Proposals

Oral Presentations


- About Grants
Research Performance Progress Report (RPPR)
The RPPR is used by recipients to submit progress reports to NIH on their grant awards. This page provides an overview of the annual RPPR, the final RPPR and the interim RPPR and provides resources to help you understand how to submit a progress report.
Types of RPPRs
Progress reports document recipient accomplishments and compliance with terms of award. There are three types of RPPRs, all of which use the NIH RPPR Instruction Guide .
- Annual RPPR – Use to describe a grant’s scientific progress, identify significant changes, report on personnel, and describe plans for the subsequent budget period or year.
- Final RPPR – Use as part of the grant closeout process to submit project outcomes in addition to the information submitted on the annual RPPR, except budget and plans for the upcoming year.
- Interim RPPR – Use when submitting a renewal (Type 2) application. If the Type 2 is not funded, the Interim RPPR will serve as the Final RPPR for the project. If the Type 2 is funded, the Interim RPPR will serve as the annual RPPR for the final year of the previous competitive segment. The data elements collected on the Interim RPPR are the same as for the Final RPPR, including project outcomes.
Submitting the RPPR
Only the project director/principal investigator (PD/PI) or their PD/PI delegate can initiate RPPRs. For multi-PD/PI grants only the Contact PI or the Contact PD/PI’s delegate can initiate the RPPR.
Signing Officials typically submit the annual RPPR, but may delegate preparation (Delegate Progress Report) to any PD/PI within the organization on behalf of the Contact PD/PI. Additionally, a Principal Investigator (PI) can delegate “Progress Report” to any eRA Commons user in their organization with the Assistant (ASST) role. This delegation provides the ASST with the ability to prepare Annual, Interim and Final RPPRs on behalf of the PI. However, only a Signing Official (SO) or PI (if delegated Submit by the SO) are allowed to submit the Annual, Interim, and Final RPPRs.
Follow the instructions in the RPPR User Guide to submit the RPPR, Interim RPPR or Final RPPR. The User Guide includes instructions for how to submit your RPPRs in the eRA Commons, how to complete the web-based forms, and what information is required. Instructions for completing the scientific portion of the report (see the elements below) may be found in Chapters 6 and 7.
The following resources may help with RPPR initiation and submission:
Annual RPPR Due Dates:
- Streamlined Non-Competing Award Process (SNAP) RPPRs are due approximately 45 days before the next budget period start date.
- Non-SNAP RPPRs are due approximately 60 days before the next budget period start date.
- Multi-year funded (MYF) RPPRs are due annually on or before the anniversary of the budget/project period start date of the award.
- The exact start date for a specific award may be found in grants status in eRA Commons.
Interim and Final RPPR Dues Dates:
- 120 days from period of performance end date for the competitive segment
The RPPR requests various types of information, including:
Accomplishments
- What were the major goals and objectives of the project?
- What was accomplished under these goals?
- What opportunities for training and professional development did the project provide?
- How were the results disseminated to communities of interest?
- What do you plan to do during the next reporting period to accomplish the goals and objectives?
- publications, conference papers, and presentations
- website(s) or other Internet site(s)
- technologies or techniques
- inventions, patent applications, and/or licenses
- other products, such as data or databases, physical collections, audio or video products, software, models, educational aids or curricula, instruments or equipment, research material, interventions (e.g., clinical or educational), or new business creation.
Participants and Other Collaborating Organizations
Changes/Problems (not required for Final or Interim RPPR)
- Changes in approach and reasons for change
- Actual or anticipated problems or delays and actions or plans to resolve them
- Changes that have a significant impact on expenditures
- Significant changes in use or care of human subjects, vertebrate animals, biohazards, and/or select agents
Budgetary Information (not required for Final or Interim RPPR)
Project Outcomes (only required on Final and Interim RPPR)
- Concise summary of the outcomes or findings of the award, written for the general public in clear and comprehensible language, without including any proprietary, confidential information or trade secrets
This page last updated on: November 2, 2022
- Bookmark & Share
- E-mail Updates
- Privacy Notice
- Accessibility
- National Institutes of Health (NIH), 9000 Rockville Pike, Bethesda, Maryland 20892
- NIH... Turning Discovery Into Health

After Submission
Post-award actions, pre-meeting, post-meeting, manage accounts.
- Submit Reports
Research Performance Progress Reports (RPPR)
Information and resources on how to submit the three variations of the Research Performance Progress Report can found on this page.
All progress reports for NIH grants must be submitted electronically using the Research Performance Progress Report (RPPR) module in eRA Commons (See OER’s RPPR webpage for details). Progress reports document the recipient’s accomplishments and compliance with terms of award.
There are three types of RPPRs:
- Annual RPPR – Used to describe a grant’s scientific progress, identify significant changes, report on personnel, and describe plans for the subsequent budget period or year.
- Interim RPPR – Used when submitting a renewal (Type 2) application. If the Type 2 is not funded, the Interim RPPR will serve as the Final RPPR for the project. If the Type 2 is funded, the Interim RPPR will serve as the annual RPPR for the final year of the previous competitive segment. The data elements collected on the Interim RPPR are the same as for the Final RPPR, including project outcomes.
- Final RPPR – Used as part of the grant closeout process to submit project outcomes in addition to the information submitted on the annual RPPR, except budget and plans for the upcoming year.
Basic Tasks (step-by-step instructions from the online help)*
- For Program Directors/Principal Investigators to initiate an RPPR
- For Signing Officials to submit an RPPR in eRA Commons
- For Signing Officials to delegate submission of an RPPR
- Submitting Your Interim Research Performance Progress Report
- Submitting Your Final Research Performance Progress Report
* You must be logged into eRA Commons with appropriate role(s) to complete these activities.
Main Screenshots

Figure 1: After logging in to eRA Commons, navigate to Status by clicking the Status button on the Home screen.

Figure 2: A signing official (SO) accesses an RPPR via the three-dot ellipsis menu in search results in the Status module.

Figure 3: A principal investigator (PI) accesses an RPPR via the RPPR button in the Status module.

Figure 4: The Annual RPPR form and navigation tabs
Interim RPPR Scenarios
| Not submitting a Competing Renewal application | Submit Final RPPR no later than 120 days from the project period end date |
| Submitting a Competing Renewal application* | Submit Interim RPPR no later than 120 days from the project period end date |
* If the competing renewal application is funded, the Interim RPPR is accepted as the Annual RPPR . If, however, the renewal is NOT funded, the Interim RPPR is accepted as the Final RPPR .
Additional Resources
- RPPR Instruction Guide
- RPPR Resources Page
- RPPR Webpage (OER)
- Grants Closeout FAQs
- RPPR Phase II Training for Grantees Webinar (Video) (November 2014)
- RPPR Phase II Training for Grantees Webinar Questions (Video) (November 2014)
- RPPR Phase II Training for Grantees (PowerPoint) (November 2014)
- RPPR: Who Can Do What? (PDF - 76KB) (September 2018)
- eRA Commons Roles & Privileges At a Glance (PDF - 25 KB)
Policy Links
- NIH Grants Policy Statement: RPPR
- NIH Grants Policy Statement: Final Progress Report
- NIH Guide Notice NOT-OD-17-085: NIH Implementation of Final RPPR for SBIR/STTR
- NIH Guide Notice NOT-OD-17-037: NIH Implementation of the Interim RPPR
- NIH Guide Notice NOT-OD-17-022: NIH Implementation of Final RPPR
- NIH Guide Notice NOT-OD-21-110: Implementation of Changes to the Biographical Sketch and Other Support Format Page
- E-mail Updates
- Older Versions of this Page
- Privacy Notice
- Accessibility
- HHS Vulnerability Disclosure
- U.S. Department of Health and Human Services
- USA.gov – Government Made Easy
- National Institutes of Health (NIH), 9000 Rockville Pike, Bethesda, Maryland 20892
- NIH... Turning Discovery Into Health

An official website of the United States government
Here's how you know
The .gov means it’s official. Federal government websites often end in .gov or .mil. Before sharing sensitive information, make sure you’re on a federal government site.
The site is secure. The https:// ensures that you are connecting to the official website and that any information you provide is encrypted and transmitted securely.
NIH releases 2022 dementia research progress report November 16, 2022

NIH has released Advancing Alzheimer’s Disease and Related Dementias Research for All Populations: Prevent. Diagnose. Treat. Care (PDF, 17.5M), a 2022 scientific progress report. This report provides a comprehensive overview of the meaningful progress researchers made from April 2021 through March 2022 to address the enormous challenges of Alzheimer’s and related dementia diseases. A few highlights of NIH-funded progress included:
- An anti-beta-amyloid vaccine that shows promise in people living with Down syndrome
- A recently launched clinical trial to test gene therapy for Alzheimer’s and mild cognitive impairment
- The first blood test for a biomarker of Alzheimer’s that is now validated in clinical trials
- Study results that suggest a specific hormone may be key to sex differences in Alzheimer’s
- The finding that speed of processing training may delay cognitive impairment
- Unraveling of links between dementia and COVID-19, and other infectious diseases
- Research that underscored how clinical trial data must be representative of all communities
- Study results showing that for people living with dementia, having a family member available to help reduced the need for paid care
- A new NIH intramural dementia research center designed to further accelerate a broad range of scientific discovery
FY 24 bypass budget
This year’s progress report was preceded by the Fiscal Year 2024 Professional Judgment Budget for Alzheimer’s Disease and Related Dementias announced in late July. Looking Forward: Opportunities to Accelerate Alzheimer’s and Related Dementias Research (PDF, 9.7M) provides an estimate of the funds needed to enable NIH to fully pursue scientific opportunities to inform effective prevention, treatment, and care of those living with these diseases.
Collaborate and connect to help us continue the work
Alzheimer’s and related dementias scientific progress at NIH is made possible by collaborations among researchers; clinicians; individuals living with dementia, their care partners, and their families; and the generous and sustained support of Congress. We encourage you to be part of this exciting time for science! Apply for funding or consider applying for an opportunity to work at NIA.
Together, we are accelerating Alzheimer’s and related dementias research to achieve optimal prevention, diagnostic, treatment, and care options. Check out our progress report (PDF 17.5M) and leave any questions or comments below.
Add new comment
A red asterisk ( * ) indicates a required field.
- Allowed HTML tags: <p> <br>
- No HTML tags allowed.
- Lines and paragraphs break automatically.
- Web page addresses and email addresses turn into links automatically.
nia.nih.gov
An official website of the National Institutes of Health
Know How to Demonstrate Scientific Progress in Annual Reports
Funding News Edition: March 20, 2024 See more articles in this edition

When you complete your annual progress report, you should also address any special reporting requirements or deadlines listed in your Notice of Award.
Most research projects do not move forward in a neat, linear fashion, steadily progressing until inevitably reaching a scientific breakthrough. So how should you describe scientific progress in your annual Research Performance Progress Report (RPPR) to demonstrate success and merit when a project is still ramping up?
What Program Officers Look For
A good first step is to know what your program officer is evaluating in a progress report. By standard procedure, program officers ask:
- Is progress satisfactory?
- Is there a change in the scope, goals, or objectives of the project?
- Is there a change in key personnel?
- Has other support changed for any key personnel named in the Notice of Award, and is there evidence of scientific overlap?
- Are there human subject issues or concerns?
- Are there animal welfare issues or concerns?
- Are there changes in the use of biohazards or select agents?
- Are there new or additional foreign components?
- If the award requires inclusion monitoring, is the enrollment date appropriate, on target, and updated in the Human Subjects System?
- Were any Products reported, such as publications, websites, technologies, inventions, or reagents?
- Is there compliance with sharing policies?
- If the award has special reporting requirements, was the information provided and acceptable?
- Is there an unobligated balance greater than 25 percent? Is the justification acceptable?
- Are there other issues that require action or documentation that must be resolved before issuing an award?
As you can tell, most of these questions concern whether the project has pivoted since the award was made or when progress was previously reported. Therefore, detail any changes to your Research Plan in the RPPR. Keep in mind, you must have prior approval from the grants management specialist assigned to your award before making Changes to Project or Budget ; do so by following the process laid out in our Prior Approvals for Post-Award Grant Actions SOP . If you requested and received approval to make a change since last submitting an RPPR, cite the previous correspondence in the current RPPR. It is not appropriate to request permission for actions that require prior approval in the RPPR.
List any adjustments in approach and reasons for the alteration. Describe any problems or delays and what actions you took or intend to take to resolve them. If there is an unobligated balance greater than 25 percent, provide a justification for why the balance remains. If authorized to carryover the balance, provide a general description of how you anticipate spending the funds. If you are not authorized to carryover an unobligated balance automatically, be prepared to submit a prior approval request for carryover.
Your program officer will assess the progress, delays, and planned next steps you describe and compare that to your budget request and justification for approval. Providing sufficient information in the progress report avoids delays to your award.
Program officers will also verify compliance with NIH Scientific Data Sharing requirements pertaining to data management and sharing, model organisms, the public access policy, and genomic data sharing; ClinicalTrials.gov registration and results reporting; and other policies for research with vertebrate animals, human subjects, biohazards, select agents, and foreign involvement.
You will also need to report any inventions made during your grant, which you should have already disclosed through iEdison following the process described at Invention Reporting .
Finally, program officers directly consider whether research progress is satisfactory.
Completing the RPPR
Recipients can demonstrate progress when completing Section B—Accomplishments of the RPPR (see section 6.2 of the NIH and Other PHS Agency RPPR Instruction Guide ). A list of publications and other products belongs in Section C—Products (see section 6.3 of the NIH and Other PHS Agency RPPR Instruction Guide). Keep in mind, you will list accomplishments since the last annual RPPR was submitted, rather than for the entire project period.
To start, list the scientific goals of the project (for NIH these are your Specific Aims) and whether they have changed. Then list your accomplishments towards each goal.
For the current reporting period describe: 1) major activities, 2) specific objectives, 3) significant results, including major findings, developments, or conclusions (both positive and negative), and 4) key outcomes or other achievements. Include a discussion of stated goals not met.
When your project is in its initial stages, these sections will focus more on the activities you undertake, e.g., enrolling study participants, preparing reagents, or testing compounds in vitro before conducting animal studies. In future reports, the focus will shift to results and research findings, e.g., showing whether variance among study interventions was statistically significant. Include data, graphs, and images to support your accomplishments section rather than relying solely on bullet-point text.
Remember, too, that NIH emphasizes rigor and transparency, so you also need to describe how your research approach ensures reproducibility.
When you complete your annual RPPR, you should also address any special reporting requirements or deadlines listed in your Notice of Award. Many solicited grants include benchmarks or go/no-go criteria that must be met before NIAID will fund an award’s next budget period. Look at your latest Notice of Award in the eRA Commons to find any special reporting requirements.
In Conclusion
Take the reporting of scientific progress seriously, including any pitfalls and ways you plan to overcome them. Doing so will help keep your research on track and lay the groundwork for a future renewal application. In certain circumstances, your program officer can work with you to help overcome science-driven obstacles.
For additional instruction and resources, refer to NIAID’s Research Performance Progress Report (RPPR) SOP .
Email us at [email protected] for help navigating NIAID’s grant and contract policies and procedures.
Stay Connected
- Subscribe to Funding News email updates
- Twitter: @NIAIDFunding
Writing a progress/status report
By michael ernst, january, 2010.
Writing a weekly report about your research progress can make your research more successful, less frustrating, and more visible to others, among other benefits.
One good format is to write your report in four parts:
- Quote the previous week's plan. This helps you determine whether you accomplished your goals.
- State this week's progress. This can include information such as: what you have accomplished, what you learned, what difficulties you overcame, what difficulties are still blocking you, your new ideas for research directions or projects, and the like.
- Give the next week's plan. A good format is a bulleted list, so we can see what you accomplished or did not. Try to make each goal measurable: there should be no ambiguity as to whether you were able to finish it. It's good to include longer-term goals as well.
- Give an agenda for the meeting. Some people like to send this as a separate message, which is fine.
The report need not be onerous. It can be a few paragraphs or a page, so it shouldn't take you long to write. Minimize details that are not relevant to your audience, such as classwork and the like, in order to keep the report focused; you will spend less time writing it, and make it more likely to be read.
Writing the progress report has many benefits.
Writing the report will make you more productive, because it will force you to think about your work in a manner concretely enough to write down. Any time that you spend organizing your thoughts will more than pay itself back in better understanding and improved productivity. When a project is complete, it is all too easy to forget some of your contributions. You can look back over your progress reports to remember what was difficult, and to think about how to work more productively in the future. You may be able to re-use some of the text when writing up your results.
Writing the report will make your meetings more productive. When you have a weekly research meeting, the report should be sent 24 hours in advance, to help everyone prepare. (Two hours is not an acceptable alternative: it does not let everyone — both you and others — mull over the ideas.) Don't delay your report because you want to wait until you have better results to report. Instead, send the report on schedule, and if you get more results in the next 24 hours, you can discuss those at the meeting.
Writing the report will give you feedback from a new point of view. The report enables others outside your research project to know what you are doing. Those people may respond with ideas or suggestions, which can help get you unstuck or give you additional avenues to explore. It also keeps you on their radar screen and reminds them of your work, which a good thing if you don't meet with them frequently. (For PhD students, a periodic report to the members of your thesis committee can pay big dividends.)
Writing the report helps explain (to yourself especially, but also to others) how you spent your time — even if there isn't as much progress as you would have preferred, you can see that you did work hard, and how to be more efficient or effective in the future.
If your meetings are more frequent than weekly, then the progress report should also be more frequent. If your meetings are less frequent, it's a good idea to still send a progress report each week.
Important tip: Throughout the day, maintain a log of what you have done. This can be a simple text file. You can update it when you start and end a task, or at regular intervals throughout the day. It takes only a moment to maintain the log, and it makes writing the report easy. By contrast, without a log you might forget what you have done during the week, and writing the report could take a long time.
Back to Advice compiled by Michael Ernst .

An official website of the United States government
Here's how you know
Official websites use .gov A .gov website belongs to an official government organization in the United States.
Secure .gov websites use HTTPS A lock ( Lock A locked padlock ) or https:// means you've safely connected to the .gov website. Share sensitive information only on official, secure websites.
NIH releases 2022 dementia research progress report
NIH has released Advancing Alzheimer’s Disease and Related Dementias Research for All Populations: Prevent. Diagnose. Treat. Care. (PDF, 17M), a 2022 scientific progress report.
The report features science advances and related efforts made between March 2021 and early 2022 in areas including drug development, lifestyle interventions, biomarker research, and more. It provides a comprehensive overview of the meaningful progress researchers are making to address the enormous health care challenges of Alzheimer’s and related dementia diseases.
This year’s progress report was preceded by the Fiscal Year 2024 Professional Judgment Budget for Alzheimer’s Disease and Related Dementias, announced in late July. Looking Forward: Opportunities to Accelerate Alzheimer’s and Related Dementias Research (PDF, 9M) provides an estimate of the funds needed to enable NIH to fully pursue scientific opportunities to inform effective prevention, treatment, and care of those living with these diseases.
Over the past year, NIH has conducted and funded remarkable Alzheimer’s and related dementias research that is bringing us closer to effective prevention, diagnostics, and treatments and improved care for the people living with these conditions, along with better support for care partners. With continued federal support and collaboration among researchers, clinicians, people living with dementia, and their care partners and families, the future holds hope and promise.
alzheimers.gov
An official website of the U.S. government, managed by the National Institute on Aging at the National Institutes of Health
- U.S. Department of Health & Human Services
- Virtual Tour
- Staff Directory
- En Español
You are here
Nih research matters.
December 22, 2021
2021 Research Highlights — Basic Research Insights
Noteworthy advances in fundamental research.
With NIH support, scientists across the United States and around the world conduct wide-ranging research to discover ways to enhance health, lengthen life, and reduce illness and disability. Groundbreaking NIH-funded research often receives top scientific honors. In 2021, these honors included Nobel Prizes to five NIH-supported scientists . Here’s just a small sample of the NIH-supported research accomplishments in 2021.
Printer-friendly version of full 2021 NIH Research Highlights
20210608-covid.jpg

Understanding SARS-CoV-2 infection
Researchers made progress in understanding how SARS-CoV-2, the virus that causes COVID-19, interacts with the human body. They found that cells in the mouth may play an important role in infection. The virus can infect inner ear cells , too, which could explain hearing and balance issues in some COVID-19 patients. Part of the damage caused by SARS-CoV-2 may relate to autoantibodies—antibodies that mistakenly attack the body’s own proteins and tissues. People who had autoantibodies before SARS-CoV-2 infection were at higher risk of developing severe COVID-19 . The virus also appears to trigger the production of new autoantibodies in some people , which may contribute to the symptoms of “long COVID.” Other scientists found that antibodies from people who were infected and then received a single dose of the Pfizer-BioNTech vaccine were similar to antibodies from uninfected people after their second shot . And researchers revealed how certain mutations in SARS-CoV-2 variants allow the virus to avoid neutralization by many antibodies.
20210608-brain.jpg

Study reveals brain cells that sustain or suppress fearful memories
Fearful memories help people and animals respond to potential dangers. But having these memories fade when they’re no longer useful is important to avoid undue stress and anxiety. Researchers identified clusters of brain cells that compete to promote either the persistence or disappearance of fearful memories. The findings could give insight into post-traumatic stress disorder (PTSD) and anxiety disorders.
20210202-gut.jpg

New ideas for fighting dangerous bacteria
Antibiotic resistance is a significant public health problem, with bacterial infections becoming increasingly difficult to treat. Researchers are exploring new ways to fight these pathogens, including harnessing proteins produced by normal gut bacteria and stimulating the natural abilities of the immune system . Scientists are also finding new antibiotic candidates inside our own cells and within proteins produced by the human body .
20210831-obesity.jpg

How fructose may contribute to obesity and cancer
Increased consumption of the sugar fructose has been linked to a rise in obesity and related cancers such as colorectal cancer. But how fructose may contribute to these conditions has been unclear. Researchers found that high levels of dietary fructose alter the gut to increase nutrient absorption in mice. The results suggest how high fructose consumption may influence obesity and certain cancers.
20211026-cortex-thumb.jpg

Mapping the mammalian motor cortex
There are trillions of neuronal connections in the human brain, and each brain is unique. Understanding the differences in people’s brains may help scientists better understand mental health, mental illness, and neurological disease. Researchers created an atlas of the cells and connections in the mammalian primary motor cortex, the brain region responsible for directing complex body movements. Derived from studies of mice, monkeys, and humans, the atlas provides a roadmap for understanding the mammalian brain.
20211130-puberty.jpg

Brain receptor linked to puberty and growth
The timing of puberty is controlled by neurons in the brain’s hypothalamus. Nutrition and body weight affect this system, but exactly how wasn’t known. Scientists identified a brain receptor that links childhood nutrition to the timing of puberty and growth. People carrying mutations in the gene for the receptor started puberty later and were often shorter than average. The findings help explain how adequate nutrition affects growth and sexual development.
20211207-cancer-thumb.jpg

Cancer cells drain energy from immune cells
Cancer cells have many ways to evade the immune system to grow and spread. Researchers discovered that cancer cells use straw-like nanotubes to siphon mitochondria from immune cells. This helps energize the cancer cells and, at the same time, disable the immune cells. Inhibiting nanotube formation could potentially make certain anticancer therapies more effective.
20211019-hair-loss.jpg

Hair loss studies yield insight into stem cells, stress, and aging
Stem cells play a vital role in regeneration and aging. Researchers found that a stress hormone impairs stem cells necessary for hair growth in mice . The findings may lead to insights into how stress affects regeneration in other parts of the body. In another study, researchers observed stem cells responsible for hair growth escaping from hair follicles in aging mice. The results give insight into how hair and tissues age, and how some diseases associated with aging may arise.
2021 Research Highlights — Human Health Advances >>
Connect with Us
- More Social Media from NIH
- - Google Chrome
Intended for healthcare professionals
- My email alerts
- BMA member login
- Username * Password * Forgot your log in details? Need to activate BMA Member Log In Log in via OpenAthens Log in via your institution
Search form
- Advanced search
- Search responses
- Search blogs
- When and how to update...
When and how to update systematic reviews: consensus and checklist
- Related content
Peer review
This article has a correction. please see:.
- Errata - September 06, 2016
- Paul Garner , professor 1 ,
- Sally Hopewell , associate professor 2 ,
- Jackie Chandler , methods coordinator 3 ,
- Harriet MacLehose , senior editor 3 ,
- Elie A Akl , professor 5 6 ,
- Joseph Beyene , associate professor 7 ,
- Stephanie Chang , director 8 ,
- Rachel Churchill , professor 9 ,
- Karin Dearness , managing editor 10 ,
- Gordon Guyatt , professor 4 ,
- Carol Lefebvre , information consultant 11 ,
- Beth Liles , methodologist 12 ,
- Rachel Marshall , editor 3 ,
- Laura Martínez García , researcher 13 ,
- Chris Mavergames , head 14 ,
- Mona Nasser , clinical lecturer in evidence based dentistry 15 ,
- Amir Qaseem , vice president and chair 16 17 ,
- Margaret Sampson , librarian 18 ,
- Karla Soares-Weiser , deputy editor in chief 3 ,
- Yemisi Takwoingi , senior research fellow in medical statistics 19 ,
- Lehana Thabane , director and professor 4 20 ,
- Marialena Trivella , statistician 21 ,
- Peter Tugwell , professor of medicine, epidemiology, and community medicine 22 ,
- Emma Welsh , managing editor 23 ,
- Ed C Wilson , senior research associate in health economics 24 ,
- Holger J Schünemann , professor 4 5
- 1 Cochrane Infectious Diseases Group, Department of Clinical Sciences, Liverpool School of Tropical Medicine, Liverpool L3 5QA, UK
- 2 Oxford Clinical Trials Research Unit, University of Oxford, Oxford, UK
- 3 Cochrane Editorial Unit, Cochrane Central Executive, London, UK
- 4 Department of Clinical Epidemiology and Biostatistics and Department of Medicine, McMaster University, Hamilton, ON, Canada
- 5 Cochrane GRADEing Methods Group, Ottawa, ON, Canada
- 6 Department of Internal Medicine, American University of Beirut, Beirut, Lebanon
- 7 Department of Mathematics and Statistics, McMaster University
- 8 Evidence-based Practice Center Program, Agency for Healthcare and Research Quality, Rockville, MD, USA
- 9 Centre for Reviews and Dissemination, University of York, York, UK
- 10 Cochrane Upper Gastrointestinal and Pancreatic Diseases Group, Hamilton, ON, Canada
- 11 Lefebvre Associates, Oxford, UK
- 12 Kaiser Permanente National Guideline Program, Portland, OR, USA
- 13 Iberoamerican Cochrane Centre, Barcelona, Spain
- 14 Cochrane Informatics and Knowledge Management, Cochrane Central Executive, Freiburg, Germany
- 15 Plymouth University Peninsula School of Dentistry, Plymouth, UK
- 16 Department of Clinical Policy, American College of Physicians, Philadelphia, PA, USA
- 17 Guidelines International Network, Pitlochry, UK
- 18 Children’s Hospital of Eastern Ontario, Ottawa, ON, Canada
- 19 Institute of Applied Health Research, University of Birmingham, Birmingham, UK
- 20 Biostatistics Unit, Centre for Evaluation, McMaster University, Hamilton, ON, Canada
- 21 Centre for Statistics in Medicine, University of Oxford, Oxford, UK
- 22 University of Ottawa, Ottawa, ON, Canada
- 23 Cochrane Airways Group, Population Health Research Institute, St George’s, University of London, London, UK
- 24 Cambridge Centre for Health Services Research, University of Cambridge, Cambridge, UK
- Correspondence to: P Garner Paul.Garner{at}lstmed.ac.uk
- Accepted 26 May 2016
Updating of systematic reviews is generally more efficient than starting all over again when new evidence emerges, but to date there has been no clear guidance on how to do this. This guidance helps authors of systematic reviews, commissioners, and editors decide when to update a systematic review, and then how to go about updating the review.
Systematic reviews synthesise relevant research around a particular question. Preparing a systematic review is time and resource consuming, and provides a snapshot of knowledge at the time of incorporation of data from studies identified during the latest search. Newly identified studies can change the conclusion of a review. If they have not been included, this threatens the validity of the review, and, at worst, means the review could mislead. For patients and other healthcare consumers, this means that care and policy development might not be fully informed by the latest research; furthermore, researchers could be misled and carry out research in areas where no further research is actually needed. 1 Thus, there are clear benefits to updating reviews, rather than duplicating the entire process as new evidence emerges or new methods develop. Indeed, there is probably added value to updating a review, because this will include taking into account comments and criticisms, and adoption of new methods in an iterative process. 2 3 4 5 6
Cochrane has over 20 years of experience with preparing and updating systematic reviews, with the publication of over 6000 systematic reviews. However, Cochrane’s principle of keeping all reviews up to date has not been possible, and the organisation has had to adapt: from updating when new evidence becomes available, 7 to updating every two years, 8 to updating based on need and priority. 9 This experience has shown that it is not possible, sensible, or feasible to continually update all reviews all the time. Other groups, including guideline developers and journal editors, adopt updating principles (as applied, for example, by the Systematic Reviews journal; https://systematicreviewsjournal.biomedcentral.com/ ).
The panel for updating guidance for systematic reviews (PUGs) group met to draw together experiences and identify a common approach. The PUGs guidance can help individuals or academic teams working outside of a commissioning agency or Cochrane, who are considering writing a systematic review for a journal or to prepare for a research project. The guidance could also help these groups decide whether their effort is worthwhile.
Summary points
Updating systematic reviews is, in general, more efficient than starting afresh when new evidence emerges. The panel for updating guidance for systematic reviews (PUGs; comprising review authors, editors, statisticians, information specialists, related methodologists, and guideline developers) met to develop guidance for people considering updating systematic reviews. The panel proposed the following:
Decisions about whether and when to update a systematic review are judgments made for individual reviews at a particular time. These decisions can be made by agencies responsible for systematic review portfolios, journal editors with systematic review update services, or author teams considering embarking on an update of a review.
The decision needs to take into account whether the review addresses a current question, uses valid methods, and is well conducted; and whether there are new relevant methods, new studies, or new information on existing included studies. Given this information, the agency, editors, or authors need to judge whether the update will influence the review findings or credibility sufficiently to justify the effort in updating it.
Review authors and commissioners can use a decision framework and checklist to navigate and report these decisions with “update status” and rationale for this status. The panel noted that the incorporation of new synthesis methods (such as Grading of Recommendations Assessment, Development and Evaluation (GRADE)) is also often likely to improve the quality of the analysis and the clarity of the findings.
Given a decision to update, the process needs to start with an appraisal and revision of the background, question, inclusion criteria, and methods of the existing review.
Search strategies should be refined, taking into account changes in the question or inclusion criteria. An analysis of yield from the previous edition, in relation to databases searched, terms, and languages can make searches more specific and efficient.
In many instances, an update represents a new edition of the review, and authorship of the new version needs to follow criteria of the International Committee of Medical Journal Editors (ICMJE). New approaches to publishing licences could help new authors build on and re-use the previous edition while giving appropriate credit to the previous authors.
The panel also reflected on this guidance in the context of emerging technological advances in software, information retrieval, and electronic linkage and mining. With good synthesis and technology partnerships, these advances could revolutionise the efficiency of updating in the coming years.
Panel selection and procedures
An international panel of authors, editors, clinicians, statisticians, information specialists, other methodologists, and guideline developers was invited to a two day workshop at McMaster University, Hamilton, Canada, on 26-27 June 2014, organised by Cochrane. The organising committee selected the panel (web appendix 1). The organising committee invited participants, put forward the agenda, collected background materials and literature, and drafted the structure of the report.
The purpose of the workshop was to develop a common approach to updating systematic reviews, drawing on existing strategies, research, and experience of people working in this area. The selection of participants aimed on broad representation of different groups involved in producing systematic reviews (including authors, editors, statisticians, information specialists, and other methodologists), and those using the reviews (guideline developers and clinicians). Participants within these groups were selected on their expertise and experience in updating, in previous work developing methods to assess reviews, and because some were recognised for developing approaches within organisations to manage updating strategically. We sought to identify general approaches in this area, and not be specific to Cochrane; although inevitably most of the panel were somehow engaged in Cochrane.
The workshop structure followed a series of short presentations addressing key questions on whether, when, and how to update systematic reviews. The proceedings included the management of authorship and editorial decisions, and innovative and technological approaches. A series of small group discussions followed each question, deliberating content, and forming recommendations, as well as recognising uncertainties. Large group, round table discussions deliberated further these small group developments. Recommendations were presented to an invited forum of individuals with varying levels of expertise in systematic reviews from McMaster University (of over 40 people), widely known for its contributions to the field of research evidence synthesis. Their comments helped inform the emerging guidance.
The organising committee became the writing committee after the meeting. They developed the guidance arising from the meeting, developed the checklist and diagrams, added examples, and finalised the manuscript. The guidance was circulated to the larger group three times, with the PUGs panel providing extensive feedback. This feedback was all considered and carefully addressed by the writing committee. The writing committee provided the panel with the option of expressing any additional comments from the general or specific guidance in the report, and the option for registering their own view that might differ to the guidance formed and their view would be recorded in an annex. In the event, consensus was reached, and the annex was not required.
Definition of update
The PUGs panel defined an update of a systematic review as a new edition of a published systematic review with changes that can include new data, new methods, or new analyses to the previous edition. This expands on a previous definition of a systematic review update. 10 An update asks a similar question with regard to the participants, intervention, comparisons, and outcomes (PICO) and has similar objectives; thus it has similar inclusion criteria. These inclusion criteria can be modified in the light of developments within the topic area with new interventions, new standards, and new approaches. Updates will include a new search for potentially relevant studies and incorporate any eligible studies or data; and adjust the findings and conclusions as appropriate. Box 1 provides some examples.
Box 1: Examples of what factors might change in an updated systematic review
A systematic review of steroid treatment in tuberculosis meningitis used GRADE methods and split the composite outcome in the original review of death plus disability into its two components. This improved the clarity of the reviews findings in relation to the effects and the importance of the effects of steroids on death and on disability. 11
A systematic review of dihydroartemisinin-piperaquine (DHAP) for treating malaria was updated with much more detailed analysis of the adverse effect data from the existing trials as a result of questions raised by the European Medicines Agency. Because the original review included other comparisons, the update required extracting only the DHAP comparisons from the original review, and a modification of the title and the PICO. 12
A systematic review of atorvastatin was updated with simple uncontrolled studies. 13 This update allowed comparisons with trials and strengthened the review findings. 14
Which systematic reviews should be updated and when?
Any group maintaining a portfolio of systematic reviews as part of their normative work, such as guidelines panels or Cochrane review groups, will need to prioritise which reviews to update. Box 2 presents the approaches used by the Agency for HealthCare Research and Quality (AHRQ) and Cochrane to prioritise which systematic reviews to update and when. Clearly, the responsibility for deciding which systematic reviews should be updated and when they will be updated will vary: it may be centrally organised and resourced, as with the AHRQ scientific resource centre (box 2). In Cochrane, the decision making process is decentralised to the Cochrane Review Group editorial team, with different approaches applied, often informally.
Box 2: Examples of how different organisations decide on updating systematic reviews
Agency for healthcare research and quality (us).
The AHRQ uses a needs based approach; updating systematic reviews depends on an assessment of several criteria:
Stakeholder impact
Interest from stakeholder partners (such as consumers, funders, guideline developers, clinical societies, James Lind Alliance)
Use and uptake (for example, frequency of citations and downloads)
Citation in scientific literature including clinical practice guidelines
Currency and need for update
New research is available
Review conclusions are probably dated
Update decision
Based on the above criteria, the decision is made to either update, archive, or continue surveillance.
Of over 50 Cochrane editorial teams, most but not all have some systems for updating, although this process can be informal and loosely applied. Most editorial teams draw on some or all of the following criteria:
Strategic importance
Is the topic a priority area (for example, in current debates or considered by guidelines groups)?
Is there important new information available?
Practicalities in organising the update that many groups take into account
Size of the task (size and quality of the review, and how many new studies or analyses are needed)
Availability and willingness of the author team
Impact of update
New research impact on findings and credibility
Consider whether new methods will improve review quality
Priority to update, postpone update, class review as no longer requiring an update
The PUGs panel recommended an individualised approach to updating, which used the procedures summarised in figure 1 ⇓ . The figure provides a status category, and some options for classifying reviews into each of these categories, and builds on a previous decision tool and earlier work developing an updating classification system. 15 16 We provide a narrative for each step.
Fig 1 Decision framework to assess systematic reviews for updating, with standard terms to report such decisions
- Download figure
- Open in new tab
- Download powerpoint
Step 1: assess currency
Does the published review still address a current question.
An update is only worthwhile if the question is topical for decision making for practice, policy, or research priorities (fig 1 ⇑ ). For agencies, people responsible for managing a portfolio of systematic reviews, there is a need to use both formal and informal horizon scanning. This type of scanning helps identify questions with currency, and can help identify those reviews that should be updated. The process could include monitoring policy debates around the review, media outlets, scientific (and professional) publications, and linking with guideline developers.
Has the review had good access or use?
Metrics for citations, article access and downloads, and sharing via social or traditional media can be used as proxy or indicators for currency and relevance of the review. Reviews that are widely cited and used could be important to update should the need arise. Comparable reviews that are never cited or rarely downloaded, for example, could indicate that they are not addressing a question that is valued, and might not be worth updating.
In most cases, updated reviews are most useful to stakeholders when there is new information or methods that result in a change in findings. However, there are some circumstances in which an up to date search for information is important for retaining the credibility of the review, regardless of whether the main findings would change or not. For example, key stakeholders would dismiss a review if a study is carried out in a relevant geographical setting but is not included; if a large, high profile study that might not change the findings is not included; or if an up to date search is required for a guideline to achieve credibility. Box 3 provides such examples. If the review does not answer a current question, the intervention has been superseded, then a decision can be made not to update and no further intelligence gathering is required (fig 1 ⇑ ).
Box 3: Examples of a systematic review’s currency
The public is interested in vitamin C for preventing the common cold: the Cochrane review includes over 29 trials with either no or small effects, concluding good evidence of no important effects. 17 Assessment: still a current question for the public.
Low osmolarity oral rehydration salt (ORS) solution versus standard solution for acute diarrhoea in children: the 2001 Cochrane review 18 led the World Health Organization to recommend ORS solution formula worldwide to follow the new ORS solution formula 19 and this has now been accepted globally. Assessment: no longer a current question.
Routine prophylactic antibiotics with caesarean section: the Cochrane review reports clear evidence of maternal benefit from placebo controlled trials but no information on the effects on the baby. 20 Assessment: this is a current question.
A systematic review published in the Lancet examined the effects of artemisinin based combination treatments compared with monotherapy for treating malaria and showed clear benefit. 21 Assessment: this established the treatment globally and is no longer a current question and no update is required.
A Cochrane review of amalgam restorations for dental caries 22 is unlikely to be updated because the use of dental amalgam is declining, and the question is not seen as being important by many dental specialists. Assessment: no longer a current question.
Did the review use valid methods and was it well conducted?
If the question is current and clearly defined, the systematic review needs to have used valid methods and be well conducted. If the review has vague inclusion criteria, poorly articulated outcomes, or inappropriate methods, then updating should not proceed. If the question is current, and the review has been cited or used, then it might be appropriate to simply start with a new protocol. The appraisal should take into account the methods in use when the review was done.
Step 2: identify relevant new methods, studies, and other information
Are there any new relevant methods.
If the question is current, but the review was done some years ago, the quality of the review might not meet current day standards. Methods have advanced quickly, and data extraction and understanding of the review process have become more sophisticated. For example:
Methods for assessing risk of bias of randomised trials, 23 diagnostic test accuracy (QUADAS-2), 24 and observational studies (ROBINS-1). 25
Application of summary of findings, evidence profiles, and related GRADE methods has meant the characteristics of the intervention, characteristics of the participants, and risk of bias are more thoroughly and systematically documented. 26 27
Integration of other study designs containing evidence, such economic evaluation and qualitative research. 28
There are other incremental improvements in a wide range of statistical and methodological areas, for example, in describing and taking into account cluster randomised trials. 29 AMSTAR can assess the overall quality of a systematic review, 30 and the ROBIS tool can provide a more detailed assessment of the potential for bias. 31
Are there any new studies or other information?
If an authoring or commissioning team wants to ensure that a particular review is up to date, there is a need for routine surveillance for new studies that are potentially relevant to the review, by searching and trial register inspection at regular intervals. This process has several approaches, including:
Formal surveillance searching 32
Updating the full search strategies in the original review and running the searches
Tracking studies in clinical trial and other registers
Using literature appraisal services 33
Using a defined abbreviated search strategy for the update 34
Checking studies included in related systematic reviews. 35
How often this surveillance is done, and which approaches to use, depend on the circumstances and the topic. Some topics move quickly, and the definition of “regular intervals” will vary according to the field and according to the state of evidence in the field. For example, early in the life of a new intervention, there might be a plethora of studies, and surveillance would be needed more frequently.
Step 3: assess the effect of updating the review
Will the adoption of new methods change the findings or credibility.
Editors, referees, or experts in the topic area or methodologists can provide an informed view of whether a review can be substantially improved by application of current methodological expectations and new methods (fig 1 ⇑ ). For example, a Cochrane review of iron supplementation in malaria concluded that there was “no significant difference between iron and placebo detected.” 36 An update of the review included a GRADE assessment of the certainty of the evidence, and was able to conclude with a high degree of certainty that iron does not cause an excess of clinical malaria because the upper relative risk confidence intervals of harm was 1.0 with high certainty of evidence. 37
Will the new studies, information, or data change the findings or credibility?
The assessment of new data contained in new studies and how these data might change the review is often used to determine whether an update should go ahead, and the speed with which the update should be conducted. The appraisal of these new data can be carried out in different ways. Initially, methods focused on statistical approaches to predict an overturning of the current review findings in terms of the primary or desired outcome (table 1 ⇓ ). Although this aspect is important, additional studies can add important information to a review, which is more than just changing the primary outcome to a more accurate and reliable estimate. Box 4 gives examples.
Formal prediction tools: how potentially relevant new studies can affect review conclusions
- View inline
Box 4: Examples of new information other than new trials being important
The iconic Cochrane review of steroids in preterm labour was thought to provide evidence of benefit in infants, and this question no longer required new trials. However, a new large trial published in the Lancet in 2015 showed that in low and middle income countries, strategies to promote the uptake of neonatal steroids increased neonatal mortality and suspected maternal infection. 49 This information needs to somehow be incorporated into the review to maintain its credibility.
A Cochrane review of community deworming in developing countries indicates that in recent studies, there is little or no effect. 50 The inclusion of a large trial of two million children confirmed that there was no effect on mortality. Although the incorporation of the trial in the review did not change the review’s conclusions, the trial’s absence would have affected the credibility of the review, so it was therefore updated.
A new paper reporting long term follow-up data on anthracycline chemotherapy as part of cancer treatment was published. Although the effects from the outcomes remained essentially unchanged, apart from this longer follow-up, the paper also included information about the performance bias in the original trial, shifting the risk of bias for several outcomes from “unknown” to “high” in the Cochrane review. 51
Reviews with a high level of certainty in the results (that is, when the GRADE assessment for the body of evidence is high) are less likely to change even with the addition of new studies, information, or data, by definition. GRADE can help guide priorities in whether to update, but it is still important to assess new studies that might meet the inclusion criteria. New studies can show unexpected effects (eg, attenuation of efficacy) or provide new information about the effects seen in different circumstances (eg, groups of patients or locations).
Other tools are specifically designed to help decision making in updating. For example, the Ottawa 39 and RAND 45 methods focus on identification of new evidence, the statistical predication tool 15 calculates the probability of new evidence changing the review conclusion, and the value of information analysis approach 52 calculates the expected health gain (table 1 ⇑ ). As yet, there has been limited external validation of these tools to determine which approach would be most effective and when.
If potentially relevant studies are identified that have not previously been assessed for inclusion, authors or those managing the updating process need to assess whether including them might affect the conclusions of the review. They need to examine the weight and certainty of the new evidence to help determine whether an update is needed and how urgent that update is. The updating team can assess this informally by judging whether new studies or data are likely to substantively affect the review, for example, by altering the certainty in an existing comparison, or by generating new comparisons and analyses in the existing review.
New information can also include fresh follow-up data on existing included studies, or information on how the studies were carried out. These should be assessed in terms of whether they might change the review findings or improve its credibility (fig 1 ⇑ ). Indeed, if any study has been retracted, it is important the authors assess the reasons for its retraction. In the case of data fabrication, the study needs to be removed from the analysis and this recorded. A decision needs to be made as to whether other studies by the same author should be removed from the review and other related reviews. An investigation should also be initiated following guidelines from the Committee on Publication Ethics (COPE). Additional published and unpublished data can become available from a wide range of sources—including study investigators, regulatory agencies and industry—and are important to consider.
Preparing for an update
Refresh background, objectives, inclusion criteria, and methods
Before including new studies in the review, authors need to revisit the background, objectives, inclusion criteria, and methods of the current review. In Cochrane, this is referred to as the protocol, and editors are part of this process. The update could range from simply endorsing the current question and inclusion criteria, through to full rewriting of the question, inclusion criteria and methods, and republishing the protocol. As a field progresses with larger and better quality trials rigorously testing the questions posed, it may be appropriate to exclude weaker study designs (such as quasi-randomised comparisons or very small trials) from the update (table 2 ⇓ ). The PUGs panel recommended that a protocol refresh will require the authors to use the latest accepted methods of synthesis, even if this means repeating data extraction for all studies.
New authors and authorship
Updated systematic reviews are new publications with new citations. An authorship team publishing an update in a scientific or medical journal is likely to manage the new edition of a review in the same way as with any other publication, and follow the ICMJE authorship criteria. 56 If the previous author or author team steps down, then they should be acknowledged in the new version. However, some might perceive that their efforts in the first version warrant continued authorship, which may be valid. The management of authorship between versions can sometimes be complicated. At worst, it delays new authors completing an update and leads to long authorship lists of people from previous versions who probably do not meet ICMJE authorship criteria. One approach with updates including new authors is to have an opt-in policy for the existing authors: they can opt in to the new edition, provided that they make clear their contribution, and this is then agreed with the entire author team.
Although they are new publications, updates will generally include content from the published version. Changing licensing rights around systematic reviews to allow new authors of future updates to remix, tweak, or build on the contributions of the original authors of the published version (similar to the rights available via a Creative Commons licence; https://creativecommons.org ) could be a more sustainable and simpler approach. This approach would allow systematic reviews to continue to evolve and build on the work of a range of authors over time, and for contributors to be given credit for contributions to this previous work.
Efficient searching
In performing an update, a search based on the search conducted for the original review is required. The updated search strategy will need to take into account changes in the review question or inclusion criteria, for example, and might be further adjusted based on knowledge of running the original search strategy. The search strategy for an update need not replicate the original search strategy, but could be refined, for example, based on an analysis of the yield of the original search. These new search approaches are currently undergoing formal empirical evaluation, but they may well provide much more efficient search strategies in the future. Some examples of these possible new methods for review updates are described in web appendix 2.
In reporting the search process for the update, investigators must ensure transparency for any previous versions and the current update, and use an adapted flow diagram based on PRISMA reporting (preferred reporting items for systematic reviews and meta-analyses). 57 The search processes and strategies for the update must be adequately reported such that they could be replicated.
Systematic reviews published for the first time in peer reviewed journals are by definition peer reviewed, but practice for updates remains variable, because an update might have few changes (such as an updated search but no new studies found and therefore included) or many changes (such as revise methods and inclusion of several new studies leading to revised conclusions). Therefore, and to use peer reviewers’ time most effectively, editors need to consider when to peer review an update and the type of peer reviewer most useful for a particular update (for example, topic specialist, methodologist). The decision to use peer review, and the number and expertise of the peer reviewers could depend on the nature of the update and the extent of any changes to the systematic review as part of an editor assessment. A change in the date of the search only (where no new studies were identified) would not require peer review (except, arguably, peer review of the search), but the addition of studies that lead to a change in conclusions or significant changes to the methods would require peer review. The nature of the peer review could be described within the published article.
Reporting changes
Authors should provide a clear description of the changes in approach or methods between different editions of a review. Also, authors need to report the differences in findings between the original and updated edition to help users decide how to use the new edition. The approach or format used to present the differences in findings might vary with the target user group. 58 Publishers need to ensure that all previous versions of the review remain publically accessible.
Updates can range from small adjustments to reviews being completely rewritten, and the PUGs panel spent some time debating whether the term “new edition” would be a better description than “update.” However, the word “update” is now in common parlance and changing the term, the panel judged, could cause confusion. However, the debate does illustrate that an update could represent a review that asks a similar question but has been completely revised.
Technology and innovation
The updating of systematic review is generally done manually and is time consuming. There are opportunities to make better use of technology to streamline the updating process and improve efficiency (table 3 ⇓ ). Some of these tools already exist and are in development or in early use, and some are commercially available or freely available. The AHRQ’s evidence based practice centre team has recently published tools for searching and screening, and will provide an assessment of the use, reliability, and availability of these tools. 63
Technological innovations to improve the efficiency of updating systematic reviews
Other developments, such as targeted updates that are performed rapidly and focus on updating only key components of a review, could provide different approaches to updating in the future and are being piloted and evaluated. 64 With implementation of these various innovations, the longer term goal is for “living” systematic reviews, which identify and incorporate information rapidly as it evolves over time. 60
Concluding remarks
Updating systematic reviews, rather than addressing the same question with a fresh protocol, is generally more efficient and allows incremental improvement over time. Mechanical rules appear unworkable, but there is no clear unified approach on when to update, and how implement this. This PUGs panel of authors, editors, statisticians, information specialists, other methodologists, and guideline developers brought together current thinking and experience in this area to provide guidance.
Decisions about whether and when to update a systematic review are judgments made at a point in time. They depend on the currency of the question asked, the need for updating to maintain credibility, the availability of new evidence, and whether new research or new methods will affect the findings.
Whether the review uses current methodological standards is important in deciding if the update will influence the review findings, quality, reliability, or credibility sufficiently to justify the effort in updating it. Those updating systematic reviews to author clinical practice guidelines might consider the influence of new study results in potentially overturning the conclusions of an existing review. Yet, even in cases where new study findings do not change the primary outcome measure, new studies can carry important information about subgroup effects, duration of treatment effects, and other relevant clinical information, enhancing the currency and breadth of review results.
An update requires appraisal and revision of the background, question, inclusion criteria, and methods of the existing review and the existing certainty in the evidence. In particular, methods might need to be updated, and search strategies reconsidered. Authors of updates need to consider inputs to the current edition, and follow ICMJE criteria regarding authorship. 56
The PUGs panel proposed a decision framework (fig 1 ⇑ ), with terms and categories for reporting the decisions made for updating procedures for adoption by Cochrane and other stakeholders. This framework includes journals publishing systematic review updates and independent authors considering updates of existing published reviews. The panel developed a checklist to help judgements about when and how to update.
The current emphasis of authors, guideline developers, Cochrane, and consequently this guidance has been on effects reviews. The checklists and guidance here still applies to other types of systematic reviews, such as those on diagnostic test accuracy, and this guidance will need adapting. Accumulative experience and methods development in reviews other than those of effects are likely to help refine guidance in the future.
This guidance could help groups identify and prioritise reviews for updating and hence use their finite resources to greatest effect. Software innovation and new management systems are being developed and in early use to help streamline review updates in the coming years.
Contributors: HJS initiated the workshop. JC, SH, PG, HM, and HJS organised the materials and the agenda. SH wrote up the proceedings. PG wrote the paper from the proceedings and coordinated the development of the final guidance; JC, SH, HM, and HJS were active in the finalising of the guidance. All PUGs authors contributed to three rounds of manuscript revision.
Funding: Attendance at this meeting, for those attendees not directly employed by Cochrane, was not funded by Cochrane beyond the reimbursement of out of pocket expenses for those attendees for whom this was appropriate. Expenses were not reimbursed for US federal government attendees, in line with US government policy. Statements in the manuscript should not be construed as endorsement by the US Agency for Healthcare Research and Quality or the US Department of Health and Human Services.
Competing interests: All participants have a direct or indirect interest in systematic reviews and updating as part of their job or academic career. Most participants contribute to Cochrane, whose mission includes a commitment to the updating of its systematic review portfolio. JC, HM, RM, CM, KS-W, and MT are, or were at that time, employed by the Cochrane Central Executive.
Provenance and peer review: Not commissioned; externally peer reviewed.
This is an Open Access article distributed in accordance with the terms of the Creative Commons Attribution (CC BY 3.0) license, which permits others to distribute, remix, adapt and build upon this work, for commercial use, provided the original work is properly cited. See: http://creativecommons.org/licenses/by/3.0/ .
- ↵ Shekelle PG, Ortiz E, Rhodes S, et al. Validity of the Agency for Healthcare Research and Quality clinical practice guidelines: how quickly do guidelines become outdated? JAMA 2001 ; 286 : 1461 - 7 . doi:10.1001/jama.286.12.1461 pmid:11572738 . OpenUrl CrossRef PubMed Web of Science
- ↵ Claxton K, Cohen JT, Neumann PJ. When is evidence sufficient? Health Aff (Millwood) 2005 ; 24 : 93 - 101 . doi:10.1377/hlthaff.24.1.93 pmid:15647219 . OpenUrl Abstract / FREE Full Text
- ↵ Fenwick E, Claxton K, Sculpher M, et al. Improving the efficiency and relevance of health technology assessment: the role of decision analytic modelling. Paper 179. Centre for Health Economics, University of York, 2000 .
- ↵ Sculpher M, Claxton K. Establishing the cost-effectiveness of new pharmaceuticals under conditions of uncertainty—when is there sufficient evidence? Value Health 2005 ; 8 : 433 - 46 . doi:10.1111/j.1524-4733.2005.00033.x pmid:16091019 . OpenUrl CrossRef PubMed Web of Science
- ↵ Sculpher M, Drummond M, Buxton M. The iterative use of economic evaluation as part of the process of health technology assessment. J Health Serv Res Policy 1997 ; 2 : 26 - 30 . pmid:10180650 . OpenUrl Abstract / FREE Full Text
- ↵ Wilson E, Abrams K. From evidence based economics to economics based evidence: using systematic review to inform the design of future research. In: Shemilt I, Mugford M, Vale L, et al, eds. Evidence based economics. Blackwell Publishing, 2010 doi:10.1002/9781444320398.ch12 .
- ↵ Chalmers I, Enkin M, Keirse MJ. Preparing and updating systematic reviews of randomized controlled trials of health care. Milbank Q 1993 ; 71 : 411 - 37 . doi:10.2307/3350409 pmid:8413069 . OpenUrl CrossRef PubMed Web of Science
- ↵ Higgins J, Green S, Scholten R. Chapter 3. Maintaining reviews: updates, amendments and feedback: Version 5.1.0 (updated March 2011). Cochrane Collaboration, 2011 .
- ↵ Cochrane. Editorial and publishing policy resource. http://community.cochrane.org/editorial-and-publishing-policy-resource . 2016.
- ↵ Moher D, Tsertsvadze A. Systematic reviews: when is an update an update? Lancet 2006 ; 367 : 881 - 3 . doi:10.1016/S0140-6736(06)68358-X pmid:16546523 . OpenUrl CrossRef PubMed Web of Science
- ↵ Prasad K, Singh MB, Ryan H. Corticosteroids for managing tuberculous meningitis. Cochrane Database Syst Rev 2016 ; 4 : CD002244 . pmid:27121755 . OpenUrl PubMed
- ↵ Zani B, Gathu M, Donegan S, Olliaro PL, Sinclair D. Dihydroartemisinin-piperaquine for treating uncomplicated Plasmodium falciparum malaria. Cochrane Database Syst Rev 2014 ; 1 : CD010927 . pmid:24443033 . OpenUrl CrossRef PubMed
- ↵ Adams SP, Tsang M, Wright JM. Lipid lowering efficacy of atorvastatin. Cochrane Database Syst Rev 2012 ; 12 : CD008226 . pmid:23235655 . OpenUrl PubMed
- ↵ Higgins J. Convincing evidence from controlled and uncontrolled studies on the lipid-lowering effect of a statin. Cochrane Database Syst Rev 2012 ; 12 : ED000049 . pmid:23361645 . OpenUrl PubMed
- ↵ Takwoingi Y, Hopewell S, Tovey D, Sutton AJ. A multicomponent decision tool for prioritising the updating of systematic reviews. BMJ 2013 ; 347 : f7191 . doi:10.1136/bmj.f7191 pmid:24336453 . OpenUrl FREE Full Text
- ↵ MacLehose H, Hilton J, Tovey D, et al. The Cochrane Library: revolution or evolution? Shaping the future of Cochrane content. Background paper for The Cochrane Collaboration’s Strategic Session Paris, France, 18 April 2012. http://editorial-unit.cochrane.org/sites/editorial-unit.cochrane.org/files/uploads/2012-CC-strategic-session_full-report.pdf .
- ↵ Hemilä H, Chalker E. Vitamin C for preventing and treating the common cold. Cochrane Database Syst Rev 2013 ;( 1 ): CD000980 . pmid:23440782 .
- ↵ Hahn S, Kim S, Garner P. Reduced osmolarity oral rehydration solution for treating dehydration caused by acute diarrhoea in children. Cochrane Database Syst Rev 2002 ;( 1 ): CD002847 . pmid:11869639 .
- ↵ World Health Organization (WHO). Reduced osmolarity oral rehydration salts (ORS) formulation. A report from a meeting of Experts jointly organized by UNICEF and WHO. New York: Child and Adolescent Health and Development, 18 July 2001 http://apps.who.int/iris/bitstream/10665/67322/1/WHO_FCH_CAH_01.22.pdf .
- ↵ Smaill FM, Grivell RM. Antibiotic prophylaxis versus no prophylaxis for preventing infection after cesarean section. Cochrane Database Syst Rev 2014 ;( 10 ): CD007482 . pmid:25350672 .
- ↵ Adjuik M, Babiker A, Garner P, Olliaro P, Taylor W, White N. International Artemisinin Study Group. Artesunate combinations for treatment of malaria: meta-analysis. Lancet 2004 ; 363 : 9 - 17 . doi:10.1016/S0140-6736(03)15162-8 pmid:14723987 . OpenUrl CrossRef PubMed Web of Science
- ↵ Agnihotry A, Fedorowicz Z, Nasser M. Adhesively bonded versus non-bonded amalgam restorations for dental caries. Cochrane Database Syst Rev 2016 ; 3 : CD007517 . pmid:26954446 . OpenUrl PubMed
- ↵ Higgins JP, Altman DG, Gøtzsche PC, et al. Cochrane Bias Methods Group Cochrane Statistical Methods Group. The Cochrane Collaboration’s tool for assessing risk of bias in randomised trials. BMJ 2011 ; 343 : d5928 . doi:10.1136/bmj.d5928 pmid:22008217 . OpenUrl FREE Full Text
- ↵ Whiting PF, Rutjes AW, Westwood ME, et al. QUADAS-2 Group. QUADAS-2: a revised tool for the quality assessment of diagnostic accuracy studies. Ann Intern Med 2011 ; 155 : 529 - 36 . doi:10.7326/0003-4819-155-8-201110180-00009 pmid:22007046 . OpenUrl CrossRef PubMed Web of Science
- ↵ Sterne JAC, Higgins JPT, Reeves BC; on behalf of the development group for ROBINS-I. A tool for assessing risk of bias in non-randomized studies of interventions, version 7. March 2016. www.riskofbias.info .
- ↵ Guyatt GH, Oxman AD, Vist GE, et al. GRADE Working Group. GRADE: an emerging consensus on rating quality of evidence and strength of recommendations. BMJ 2008 ; 336 : 924 - 6 . doi:10.1136/bmj.39489.470347.AD pmid:18436948 . OpenUrl FREE Full Text
- ↵ Schünemann HJ. Interpreting GRADE’s levels of certainty or quality of the evidence: GRADE for statisticians, considering review information size or less emphasis on imprecision? J Clin Epidemiol 2016 ; 75 : 6 - 15 . doi:10.1016/j.jclinepi.2016.03.018 pmid:27063205 . OpenUrl CrossRef PubMed
- ↵ Gough D. Qualitative and mixed methods in systematic reviews. Syst Rev 2015 ; 4 : 181 . doi:10.1186/s13643-015-0151-y pmid:26670769 . OpenUrl CrossRef PubMed
- ↵ Richardson M, Garner P, Donegan S. Cluster randomised trials in Cochrane reviews: evaluation of methodological and reporting practice. PLoS One 2016 ; 11 : e0151818 . doi:10.1371/journal.pone.0151818 pmid:26982697 . OpenUrl CrossRef PubMed
- ↵ Shea BJ, Grimshaw JM, Wells GA, et al. Development of AMSTAR: a measurement tool to assess the methodological quality of systematic reviews. BMC Med Res Methodol 2007 ; 7 : 10 . doi:10.1186/1471-2288-7-10 pmid:17302989 . OpenUrl CrossRef PubMed
- ↵ Whiting P, Savović J, Higgins JP, et al. ROBIS group. ROBIS: A new tool to assess risk of bias in systematic reviews was developed. J Clin Epidemiol 2016 ; 69 : 225 - 34 . doi:10.1016/j.jclinepi.2015.06.005 pmid:26092286 . OpenUrl CrossRef PubMed
- ↵ Sampson M, Shojania KG, McGowan J, et al. Surveillance search techniques identified the need to update systematic reviews. J Clin Epidemiol 2008 ; 61 : 755 - 62 . doi:10.1016/j.jclinepi.2007.10.003 pmid:18586179 . OpenUrl CrossRef PubMed Web of Science
- ↵ Hemens BJ, Haynes RB. McMaster Premium LiteratUre Service (PLUS) performed well for identifying new studies for updated Cochrane reviews. J Clin Epidemiol 2012 ; 65 : 62 - 72.e1 . doi:10.1016/j.jclinepi.2011.02.010 pmid:21856121 . OpenUrl CrossRef PubMed
- ↵ Sagliocca L, De Masi S, Ferrigno L, Mele A, Traversa G. A pragmatic strategy for the review of clinical evidence. J Eval Clin Pract 2013 ; 19 : 689 - 96 . doi:10.1111/jep.12020 pmid:23317014 . OpenUrl CrossRef PubMed
- ↵ Rada G, Peña J, Capurro D, et al. How to create a matrix of evidence in Epistemonikos. Abstracts of the 22nd Cochrane Colloquium; Evidence-informed public health: opportunities and challenges; Hyderabad, India. Cochrane Database Syst Rev 2014 ; suppl 1 : 132 .
- ↵ Okebe JU, Yahav D, Shbita R, Paul M. Oral iron supplements for children in malaria-endemic areas. Cochrane Database Syst Rev 2011 ;( 10 ): CD006589 . pmid:21975754 .
- ↵ Neuberger A, Okebe J, Yahav D, Paul M. Oral iron supplements for children in malaria-endemic areas. Cochrane Database Syst Rev 2016 ; 2 : CD006589 . pmid:26921618 . OpenUrl PubMed
- Balshem H, Helfand M, Schünemann HJ, et al. GRADE guidelines: 3. Rating the quality of evidence. J Clin Epidemiol 2011 ; 64 : 401 - 6 . doi:10.1016/j.jclinepi.2010.07.015 pmid:21208779 . OpenUrl CrossRef PubMed Web of Science
- ↵ Chung M, Newberry SJ, Ansari MT, et al. Two methods provide similar signals for the need to update systematic reviews. J Clin Epidemiol 2012 ; 65 : 660 - 8 . doi:10.1016/j.jclinepi.2011.12.004 pmid:22464414 . OpenUrl CrossRef PubMed
- Shojania KG, Sampson M, Ansari MT, Ji J, Doucette S, Moher D. How quickly do systematic reviews go out of date? A survival analysis. Ann Intern Med 2007 ; 147 : 224 - 33 . doi:10.7326/0003-4819-147-4-200708210-00179 pmid:17638714 . OpenUrl CrossRef PubMed Web of Science
- Shojania K, Sampson M, Ansari M, et al. Updating systematic reviews; AHRQ technical reviews; report no 07-0087. Agency for Healthcare Research and Quality, 2007 .
- Pattanittum P, Laopaiboon M, Moher D, Lumbiganon P, Ngamjarus C. A comparison of statistical methods for identifying out-of-date systematic reviews. PLoS One 2012 ; 7 : e48894 . doi:10.1371/journal.pone.0048894 pmid:23185281 . OpenUrl CrossRef PubMed
- Shekelle PG, Motala A, Johnsen B, Newberry SJ. Assessment of a method to detect signals for updating systematic reviews. Syst Rev 2014 ; 3 : 13 . doi:10.1186/2046-4053-3-13 pmid:24529068 . OpenUrl CrossRef PubMed
- Shekelle PG, Newberry SJ, Wu H, et al. Identifying signals for updating systematic reviews: a comparison of two methods; report no 11-EHC042-EF. Agency for Healthcare Research and Quality, 2011 .
- ↵ Shekelle P, Newberry S, Maglione M, et al. Assessment of the need to update comparative effectiveness reviews: report of an initial rapid program assessment (2005-2009). Agency for Healthcare Research and Quality, 2009 .
- Tovey D, Marshall R, Bazian, Hopewell S, Rader T. Fit for purpose: centralised updating support for high-priority Cochrane Reviews; National Institute for Health Research Cochrane-National Health Service Engagement Award Scheme, July 2011. https://editorial-unit.cochrane.org/sites/editorial-unit.cochrane.org/files/uploads/10_4000_01%20Fit%20for%20purpose%20-%20centralised%20updating%20support%20for%20high%20priority%20Cochrane%20Reviews%20FINAL%20REPORT.pdf .
- Claxton K. The irrelevance of inference: a decision-making approach to the stochastic evaluation of health care technologies. J Health Econ 1999 ; 18 : 341 - 64 . doi:10.1016/S0167-6296(98)00039-3 pmid:10537899 . OpenUrl CrossRef PubMed Web of Science
- Wilson EC. A practical guide to value of information analysis. Pharmacoeconomics 2015 ; 33 : 105 - 21 . doi:10.1007/s40273-014-0219-x pmid:25336432 . OpenUrl CrossRef PubMed
- ↵ Althabe F, Belizán JM, McClure EM, et al. A population-based, multifaceted strategy to implement antenatal corticosteroid treatment versus standard care for the reduction of neonatal mortality due to preterm birth in low-income and middle-income countries: the ACT cluster-randomised trial. Lancet 2015 ; 385 : 629 - 39 . doi:10.1016/S0140-6736(14)61651-2 pmid:25458726 . OpenUrl CrossRef PubMed
- ↵ Taylor-Robinson D, Maayan N, Soares-Weiser K, et al. Deworming drugs for soil-transmitted intestinal worms in children: effects on nutritional indicators, haemoglobin and school performance. Cochrane Database Syst Rev 2012 ;( 11 ): CD000371 .
- ↵ van Dalen EC, van der Pal HJ, Kremer LC. Different dosage schedules for reducing cardiotoxicity in people with cancer receiving anthracycline chemotherapy. Cochrane Database Syst Rev 2016 ; 3 : CD005008 . pmid:26938118 . OpenUrl PubMed
- ↵ Wilson E. on behalf of the Cochrane Priority Setting and Campbell & Cochrane Economics Methods Groups. Which study when? Proof of concept of a proposed automated tool to help decision which reviews to update first. Cochrane Database Syst Rev 2014 ; suppl 2 : 29 - 31 .
- Rosenbaum SE, Glenton C, Nylund HK, Oxman AD. User testing and stakeholder feedback contributed to the development of understandable and useful Summary of Findings tables for Cochrane reviews. J Clin Epidemiol 2010 ; 63 : 607 - 19 . doi:10.1016/j.jclinepi.2009.12.013 pmid:20434023 . OpenUrl CrossRef PubMed
- Rosenbaum SE, Glenton C, Oxman AD. Summary-of-findings tables in Cochrane reviews improved understanding and rapid retrieval of key information. J Clin Epidemiol 2010 ; 63 : 620 - 6 . doi:10.1016/j.jclinepi.2009.12.014 pmid:20434024 . OpenUrl CrossRef PubMed Web of Science
- Vandvik PO, Santesso N, Akl EA, et al. Formatting modifications in GRADE evidence profiles improved guideline panelists comprehension and accessibility to information. A randomized trial. J Clin Epidemiol 2012 ; 65 : 748 - 55 . doi:10.1016/j.jclinepi.2011.11.013 pmid:22564503 . OpenUrl CrossRef PubMed
- ↵ International Committee of Medical Journal Editors (ICMJE). Defining the role of authors and contributors. 2016. www.icmje.org/recommendations/browse/roles-and-responsibilities/defining-the-role-of-authors-and-contributors.html .
- ↵ Stovold E, Beecher D, Foxlee R, Noel-Storr A. Study flow diagrams in Cochrane systematic review updates: an adapted PRISMA flow diagram. Syst Rev 2014 ; 3 : 54 . doi:10.1186/2046-4053-3-54 pmid:24886533 . OpenUrl CrossRef PubMed
- ↵ Newberry SJ, Shekelle PG, Vaiana M, et al. Reporting the findings of updated systematic reviews of comparative effectiveness: how do users want to view new information? report no 13-EHC093-EF. Agency for Healthcare Research and Quality, 2013 .
- Marshall IJ, Kuiper J, Wallace BC. Automating risk of bias assessment for clinical trials BCB’14. Proceedings of the 5th ACM conference on Bioinformatics, computational biology, and health informatics. 2014:88-95. http://thirdworld.nl/automating-risk-of-bias-assessment-for-clinical-trials .
- ↵ Elliott JH, Turner T, Clavisi O, et al. Living systematic reviews: an emerging opportunity to narrow the evidence-practice gap. PLoS Med 2014 ; 11 : e1001603 . doi:10.1371/journal.pmed.1001603 pmid:24558353 . OpenUrl CrossRef PubMed
- Elliott J, Sim I, Thomas J, et al. #CochraneTech: technology and the future of systematic reviews. Cochrane Database Syst Rev 2014 ;( 9 ): ED000091 . pmid:25288182 .
- Cochrane. Project transform: the Cochrane Collaboration. 2016. http://community.cochrane.org/tools/project-coordination-and-support/transform .
- ↵ Paynter R, Bañez L, Berlinerm E, et al. EPC methods: an exploration of the use of text-mining software in systematic reviews. Research white paper. AHRQ publication 16-EHC023-EF. Agency for Healthcare Research and Quality, April 2016. https://www.effectivehealthcare.ahrq.gov/search-for-guides-reviews-and-reports/?pageaction=displayproduct&productID=2214 .
- ↵ Soares-Weiser K, Marshall R, Bergman H, et al. Updating Cochrane Reviews: results of the first pilot of a focused update. Cochrane Database Syst Rev 2014 ; suppl 1 : 31 - 3 .
Advisory boards aren’t only for executives. Join the LogRocket Content Advisory Board today →
- Product Management
- Solve User-Reported Issues
- Find Issues Faster
- Optimize Conversion and Adoption
How to write an effective progress report

As someone who has written hundreds of progress reports, I know that writing a good progress report can keep people in the loop about how your project or product is moving. Additionally, it helps build trust by actively letting everyone know how things are going, what may have changed, and where you may need support. It can be a very helpful tool.

Getting started with writing progress updates can be a little tricky. There are some key steps you’ll want to navigate to ensure that your progress reports are effective, helpful, and meeting the needs of your team and stakeholders.
In this article, we’ll talk about what a progress report is, why they’re important, the elements of a progress report, and more.
What is a progress report?
A progress report is a document, usually in the form of a weekly email, that lets key stakeholders and team members who are involved in your project stay up-to-date on how things are going.
These updates can include the progress from this week, whether or not the project is on track, and if any additional leadership support is necessary to keep the project going smoothly and eliminate blockers or challenges.
Why are progress reports important?
Progress reports are important because they help build trust in the project team by keeping stakeholders in the loop with clear communication. A good progress report ensures that stakeholders don’t sit and wonder how a project is going.
Another benefit? They can help you spot issues and elevate them before problems stack up and take your project off course. You can also use a progress report to escalate blockers, or potential blockers, to the stakeholders who may be able to assist you in clearing them. Need approval before you move forward with a key part of the project? You can outline that in your update and let everyone know to expect this before it happens.
Progress reports also help keep a pulse on the pace of the project. If you know that you have important dates coming up, knowing that you have a regular time you’ll need to check in on the progress of the project can help you know if you’re on schedule.
If things start to get off track, you’ll be able to course-correct easier. And, since a progress report keeps your stakeholders in the loop, there are no big surprises to anyone if something doesn’t go according to plan.
What’s included in a progress report?
The first important thing is to really understand what your stakeholders want to see in an update. Are there particular parts of the project they might be concerned about and want more detailed insights into how that part of the project is going? If so, you may want to come up with a list and build your outline from there.
A comprehensive progress report typically includes:
- A summary of activities completed by the team
- What progress was made, and how the team is tracking toward their goals
- What challenges there were, if any
- Action items and any next steps
Activity summary
In the activity summary, you can be as detailed as is helpful to communicate to stakeholders. Ask if your stakeholders want either an in-depth or high-level summary of the work that was completed by the team.

Over 200k developers and product managers use LogRocket to create better digital experiences
For example, some stakeholders want to be able to see each individual item the team completed. Some stakeholders think that a high-level summary of features is enough information. You can customize the level of detail in your activity summary for your stakeholders and team.
Progress update
Your activity summary and progress updates might sound similar, but activities are usually more task-oriented while progress is usually either an outcome or progress toward a specific outcome.
For example, let’s say that your progress update outlines that your engineering team spent time writing code for a new feature this week. Your progress report may include details about customer feedback about the new feature that your UX designer gathered.
Challenges and obstacles
While it may not be easy to talk about challenges or difficulties during a project, your stakeholders will want to know what challenges came up, how they were handled, if they’ve changed the timeline of the project, and if the team needs any help.
A great way to talk through the challenges section of your progress report is to follow a simple format:
- A brief description of the challenge encountered. This should be no longer than 2–3 sentences.
- A brief outline of how the challenge was addressed
- A clear statement of whether or not the challenge is still being resolved
- A clear ask for help, if help or support is needed
For example, here’s how this might sound in an actual progress report:
Dealing with API challenges with VendorX
This week, we had an outage in production due to a breaking API change that was made by VendorX. The customer impact was that our app was unavailable for 30 minutes. Customers saw an error message. To resolve the issue, we reached out to VendorX tech support and let them know the issue was impacting our app. They were able to resolve it, and our customers no longer have this issue.
Next steps and action items
At the end of the progress report, you’ll want to give a brief description of what the team plans to do next on the project to keep momentum. This can include the upcoming tasks or activities the team intends to tackle and how this keeps the project moving forward.
More great articles from LogRocket:
- How to implement issue management to improve your product
- 8 ways to reduce cycle time and build a better product
- What is a PERT chart and how to make one
- Discover how to use behavioral analytics to create a great product experience
- Explore six tried and true product management frameworks you should know
- Advisory boards aren’t just for executives. Join LogRocket’s Content Advisory Board. You’ll help inform the type of content we create and get access to exclusive meetups, social accreditation, and swag.
If you are dealing with a challenge, this section may also include the challenge’s impact on progress and how you may need to plan accordingly.
If you’re thinking that sounds like a lot to keep up with, there’s a great way to make it easier — use a template.
Using a template to make progress reports that are quick and easy to read
Progress report templates are easy to create and iterate over time as the needs of the project change. Templates can make writing your progress report faster and easier. Another key benefit of using a template? It’s easier to ask for help from your teammates to help fill in the key details because you can ask them to fill out key sections.
Templates also help your stakeholders know what to expect each week. By sending the same format each week, it can make it easy to know where the relevant information they need will be located in the progress report.
Here is a very simple template on Google Docs that you can use as a weekly progress report. Go to File > Make a copy to download it and, as we’ll go over next, you can customize it how you like to fit the needs of your project:

Tips for customizing a template
Progress reports aren’t one-size-fits-all. In fact, they should be customized to fit the needs of your project! Here are some tips to help customize a generic template:
- Make sections clear — Clearly outline the sections of your progress report, and let everyone know what you’ll be addressing in each section. Remember the key sections: activities, progress made, challenges or blockers encountered, and actions and next steps. You may want to include other sections, but you’ll want to include at least those four
- Include other sections as needed for your project — Depending on the type of project, you may also include area-specific updates. If you are building a new software product, you may also include an update on KPIs or customer feedback. If you work on an engineering team, you may need to update on code quality or test coverage metrics. Remember, this is for you and for your stakeholders to communicate, so customizing it to everyone’s needs is important
- Add some fun — Maybe you highlight new learnings, a fun fact, or a customer research anecdote as a part of your update
- Use emojis — Another way to make sections stand out is to add emojis. On a Mac, you can use Control + Command + Space to pull up the emoji keyboard. On a Windows machine, you can use the Windows Key + Period . Add emojis to your sections to add a little fun, and make each section’s purpose stand out visually. Adding an emoji can help visually call out sections. You can also use emojis for whether or not something is on track by using colors and color coding.
- Make updating and reading metrics easy by using tables — If you’re reporting on a lot of metrics , make those easy to update by utilizing tables when and where you can. On the left side, include the name of the metric. On the right, include the number. Voila, an easy-to-read and easy-to-update metrics table
Once you’ve got the template, where do you store it? Ideally, put the template where you can quickly and easily access it and send it. Do you use a document repository like Sharepoint or Confluence? You can create a page that you can duplicate and edit. If you use something like Notion, you can save the page as a template that you can quickly and easily apply to any page within Notion.
Another thing to consider is how you plan to send the update each week. One option is to link to a document repository that has all of the updates linked and just schedule an automated email to send to key stakeholders with a link to the homepage. Another option? Copy and paste the text from your update into an email and link to older updates that live elsewhere.
When to update your template
If you feel trapped using a template, know that you can customize them and change them over time. As the project changed and evolved, so did our progress updates. It’s okay to change them! In fact, sometimes it’s necessary. So how do you know when it’s time to change your template?
- You regularly get questions from stakeholders about aspects of your project that are not answered in the current template
- The project has taken on a completely new direction but you haven’t updated your progress report to capture these new aspects of the project
- You’ve added another team or aspect to the project but their work is not reflected in the template
All of these are signs that it’s time to update the template to include more or different information. This can be a great time to pause and ask your stakeholders what new information would be helpful for them to read about in the progress report.
Incorporating progress report comments
Your stakeholders may have follow-up questions or comments about your progress report. This is great news because it means that your stakeholders are involved and staying up to date! Of course, they may have positive feedback or negative feedback. How do you handle either situation?
Handling negative feedback about your progress report from stakeholders
You’ve sent out the progress report, and you’re excited to hear all of the positive comments on how much progress the team is making. Then the comments start rolling in, and they are disappointingly not positive. How do you address negative comments from stakeholders?
There is negative feedback about the formatting
Sometimes, stakeholders may have negative feedback about how the progress report looks instead of commenting on the contents of the report itself. This can be a good thing — they have an interest in the process!
Take their feedback into consideration and potentially make updates to the template to make incorporating their feedback easier from week to week. If there’s a way to make the report easier to read, make those adjustments. If data is missing that would help make decisions — and if the data is available — consider adding it to subsequent progress reports.
There is negative feedback about the progress being made
Sometimes, stakeholders will have questions or comments related to how quickly the project is moving or the challenges the team is encountering. Here are some steps on how to handle this when it comes up.
- First, try to understand where the stakeholder is coming from. Are they curious about why a challenge arose? Are they concerned about the progress so far? Are they nervous about missing a critical deadline? You may need to reach out to that stakeholder to understand their concerns or feedback better so that you know how you can help
- Once you understand where the concern is coming from, now you can work to address the stakeholder’s feedback or criticism. If they address a challenge that has come up, it may be a good time to escalate the support you need in clearing the blocker. If they’re addressing that it seems like the project is off-track, reiterate what you or the team are doing to ensure that the project stays on track
- Sometimes, negative feedback occurs because someone is missing context or does not have all the information. In this case, it can be helpful to ensure that the stakeholder understands
Handling positive feedback about your progress report
When you get positive feedback about the progress you’re making, this is a great time to share that feedback with the entire team and celebrate. There are ways to incorporate this kind of feedback into your team’s rhythms.
One way is to surface positive feedback at a daily standup or weekly team meeting, letting them know that the leadership team or external stakeholders are happy with the progress are cheering you on. If appropriate, inviting a stakeholder to a team meeting and letting them know they’re excited about the progress can be a fun addition.
Conclusion and key takeaways
Progress reports can help keep your stakeholders in the loop, build trust, and keep them up to date about what’s happening within your project. Remember that good progress reports adapt and change as you get feedback from your stakeholders and as the project needs change. Templating your progress reports can help you save time and allow others to contribute as you assign segments to other members of the team.
Remember that you can also keep it fun by adding your touch to it. If negative feedback arises, incorporate what you can. And when positive feedback comes up, remember to pass it on.
Featured image source: IconScout
LogRocket generates product insights that lead to meaningful action
Get your teams on the same page — try LogRocket today.
Share this:
- Click to share on Twitter (Opens in new window)
- Click to share on Reddit (Opens in new window)
- Click to share on LinkedIn (Opens in new window)
- Click to share on Facebook (Opens in new window)
- #collaboration and communication

Stop guessing about your digital experience with LogRocket
Recent posts:.

Enhancing product stickiness for increased user retention
A great value proposition might entice a user in the beginning, but you still need a way to maintain their loyalty for years to come.

Understanding technical debt: Beyond code quality
A proactive approach to technical debt leads to faster recovery, better performance, and a healthier product. With the right strategies, you can manage it without sacrificing innovation.

Collaboration between product management and marketing
Product management and product marketing both contribute to the success of a product in their own capacity.

Leader Spotlight: Knowing where customers are aiming, with Ravit Danino
Ravit Danino talks about how knowing where customers are aiming helps you better frame the discussion around your roadmap.

Leave a Reply Cancel reply
Progress in Cancer Research
Basic, molecular, epidemiologic, and clinical research are leading to improved cancer prevention, screening, and treatment. Decreasing cancer mortality death rates and increasing numbers of cancer survivors are important indicators of the progress we have made. As the leader of the National Cancer Program, NCI has played a major role in the progress that has been made by the cancer community. But work still needs to be done to reduce the burden of cancer for those who face a diagnosis.
Progress in research depends on the work of individual scientists and research institutions—universities and medical centers across the country, the NCI-designated cancer centers, the National Clinical Trials Network, the NCI Community Oncology Research Program—as well as collaborations between the private and public sector. In this section, we highlight the stories behind some notable milestones and present data about ongoing progress.

Annual Report to the Nation on the Status of Cancer
The Annual Report to the Nation on the Status of Cancer is an update of rates for new cases, deaths, and trends for the most common cancers in the United States.

Cancer Trends Progress Report
The Cancer Trends Progress Report summarizes the nation’s advances against cancer in relation to Healthy People targets set out by the Department of Health and Human Services.

Research Advances by Cancer Type
Find NCI’s collection of research advances for common cancers such as breast cancer, colorectal cancer, leukemia, lung cancer, and prostate cancer.

Stories of Discovery
Collection of stories that describe landmark developments in cancer prevention and treatment supported by NCI funding.

Milestones in Cancer Research and Discovery
During the past 250 years, we have witnessed many landmark discoveries in our efforts to make progress against cancer, an affliction known to humanity for thousands of years. This timeline shows a few key milestones in the history of cancer research.
👀 Turn any prompt into captivating visuals in seconds with our AI-powered design generator ✨ Try Piktochart AI!
Progress Report: How to Write, Structure, and Make Project Progress Visually Attractive

Picture this: Days or weeks into a project, your supervisor asks for a progress report.
Depending on your experience with writing progress reports, you might respond with readiness, anxiety, or confusion. Where do you begin? How do you know you’ve created a satisfactory or even amazing final report? Fear not—the expert team here at Piktochart is here to help.
In this progress reporting guide, we’ll not only give you top tips on how to write a successful report but additionally provide you with progress report templates and checklists to keep you focused on the important stuff. We begin, of course, with the all-important question anyone from a newbie to even a seasoned professional might have: “What is a progress report?”
Table of contents:
What is a progress report, why is a progress report important.
- How to write a progress report
- How to structure a progress report
- Free progress report templates you can edit right away
Progress report checklist
In case you prefer watching over reading, feel free to check out the video summary of this blog post:
A progress report is exactly what it sounds like—a document using simple and straightforward language that explains in detail what has been achieved and what else is needed for project completion. Essentially this document is a status update before the final report, outlining tasks completed by a team member, project manager, or team, along with what else needs to be done.
W hether you need to provide daily progress reports or even quarterly progress reports, this asset outlines the activities you’ve carried out, the tasks you’ve completed, and the milestones you’ve reached vis-à-vis your project plan .
Depending on the scope and complexity of the project, you might need to give a progress report weekly or monthly or for every 25% project milestone.
In terms of audience, a progress report is typically written for a supervisor, colleague, or client. Progress reports can be written from the perspective of one person as well as an entire team or department.
Throughout your career, you’re likely to be creating more reports than you can count (challenge for you: count them and find how many resources you’re using!).
Perhaps you find yourself spending more time crunching data and plugging numbers into graphs than actually working.
Reports don’t have to be as time-consuming as they often are. Progress report templates are time-savers! Get your free Piktochart account so you can follow along as we share more templates below.
We also tapped into the brilliance of Kevan Lee of Buffer in this interactive content experience to help you with your progress report projects.
Dive right in here, and learn some reporting hacks from Kevan .
Sometimes it might feel like writing about your progress in detail is redundant, especially when you’ve been regularly communicating with your supervisor, teammates, and client throughout the course of the project. Like any project manager, you probably think there are more important things to work on.
But this type of professional report is actually quite useful for several reasons.
1. It gets everyone on the same page
Each person who receives a copy of the report will know what has been accomplished and what is remaining. This prevents confusion about what has been or has yet to be done. Additionally, it provides proof and data about the respective project that can be cited and sourced if and when questions arise in the future.
2. Writing progress reports facilitates collaboration
This is especially important when different teams or departments work together. Knowing what another team is prioritizing helps prevent working in silos and also reduces task redundancy. Additionally, progress reporting helps a team identify areas where it can offer help or collaborate with others.
When teams can track progress on where other teams are on the project timeline, project managers get a better idea of the current status. They can reassign resources to make sure everyone is on track to hit the deadline for the current project, which can be tricky if you’re managing remote teams .
If you’d like to learn more about how you can work together with your team on a report, sign up for a free Piktochart account and try our online report maker .
3. It improves transparency and accountability by providing a paper trail
When you submit your report, you’ve placed on record that you’ve accomplished a task or explained why your results were different than expected. Once the document has been accepted, it becomes part of the project’s official documentation.
So, just in case someone accuses you in the future of failing to accomplish a task or not reporting a problem, you can point to the progress report as proof that you did so.
On the flip side, if your project ever gets nominated for an award, you can be sure validators will come seeking documents that explain how the entire thing was accomplished.
4. It improves project evaluation and review
Next time you plan for a project, your team can examine documents, including progress reports, of previous projects to find out what was done right, what went wrong, and what can be improved.
Previous reports can shed light on systemic issues, loopholes, and other causes of delay or failure—both internal and external—that must be avoided or resolved.
5. It provides insights for future planning
When the supervisor knows what tasks have been accomplished, he or she can focus on monitoring progress toward the next stages of the project.
When a report shows that delays have occurred, the supervisor is able to investigate the problems that hindered progress and take steps to prevent them from happening again in the future.
The supervisor will also be able to adjust the project timeline if absolutely needed or instruct teams to double down.
Ultimately, all the valuable insights from the project documentation can increase the chance of success for future projects.
Here is a progress report format example:

How to write progress report s
Have you ever found yourself stuck tapping your pen or staring at a blinking cursor, unable to begin writing?
Writer’s block is not an unusual experience when creating progress reports, especially for those whose jobs typically don’t involve drafting a long document or creating a formal report.
One reason people may find it difficult to write these reports is the thought that they’re not ‘writers.’ Yet, this is simply a negative mindset.
Reports don’t require sophisticated language—in fact, the simpler, the better.
Here are some writing tips on progress reporting:
“Piktochart is my go-to tool when I’m looking for a way to summarize data that is easy for our upper management to review. Piktochart provides me with the tools to display data in a creative, visually appealing way.” – Erica Barto, Selection, Testing & Assessment Specialist at Valero Energy Corporation Create a report, presentation, infographic, or other visuals online with Piktochart. You don’t need any graphic design experience to make professional visual content. Sign up for free .
1. Think of it as a Q&A
Before you start worrying about your reporting frequency and whether you should provide monthly reports or weekly reports, take a step back and focus on the purpose of the report itself.
In essence, the reporting process comes down to Q&A; you’re answering key questions about your progress. Imagine your manager, colleagues, or client asking you their most important questions, and you’re simply providing them with answers on the project status.
For example, let’s say that you’re organizing a weekend fair with food stalls and music and that you’re put in charge of food concessions.
The project plan might require you to have secured letters of intent (LOI) from at least 10 businesses by the end of the first month.
Your progress report would then outline the companies or entrepreneurs who have sent LOIs, including a description of their businesses and plans for their food stalls. If talks are in progress with other businesses that haven’t yet sent LOIs, you can include that and explain when they’re expected to send in their letters.
On the other hand, if you haven’t met your target, you’d have to explain why but also narrate the efforts you have exerted and the expected timeline for achieving the desired results.

2 . Use simple and straightforward language
This doesn’t mean you can’t use technical jargon.
For example, if you’re in the construction business, you don’t have to avoid using terms like “tender” or “variation” or “risk management.”
But otherwise, speak plainly. Use clear and concise language.
One misconception in business writing is that complexity impresses. In truth, it only causes confusion. Fact is, being able to speak plainly about your subject indicates that you understand your subject matter inside out.
Let’s get specific. One thing that makes business documents dreary is the transformation of verbs into nouns—just like I did there.
If we had to rephrase that to keep the verb, we’d write, “transforming verbs into nouns.” It sounds simpler and gets to the point.

3 . Avoid using the passive voice where possible
Sometimes, you can’t avoid using the passive voice in formal documents that prohibit the first-person point-of-view. But when done well, it helps to make your progress reports more relatable.
Going back to the food concession example, a passive sentence would read: “Research on potential food concessionaires was carried out.”
To make that sentence active, give it an actor (which is the team in this case), as in: “The team researched on potential food concessionaires.”
4. Be specific
A study published in the Journal of Cognitive Neuroscience found that when you use concrete words, you tend to engage both the left and right parts of the brain, while the right region tends to remain unstimulated by abstract words.
While the jury is still out on exactly how word meanings are represented in the mind, we can agree that the phrase “a merry sound” doesn’t stir the imagination as much as “tinkling bells”.
“A hot day” doesn’t activate visual imagery as much as “a melting popsicle” does. When a reader’s mind is stimulated by words, it’s less likely to drift off.

Taking the previous example, “researched on potential food concessionaires” doesn’t evoke a visual image. Meanwhile, “built a list of 50 potential food concessionaires” is more concrete, especially when you add details of what food items might be sold.
5. Explain jargon if needed
This depends on who will be reading your progress reports, and if you’re using very specialized jargon that only members of your team would be familiar with.
For example, in a report written by a construction team addressed to the project manager , construction jargon could be used as the recipient obviously understands it.
6. Spell out acronyms when they first occur in the document
Don’t assume that every single person reading the report will understand all the acronyms you use without you spelling them out.
For instance, in construction work, SWMS should first be spelled out as “safe work method statement”. ‘Pre-starts’ should be spelled out as ‘pre-start checks’. So in your report, it would look like this: “safe work method statement (SWMS)”, then all subsequent references are free to just be SWMS.
7. Stick to facts
Avoid providing an opinion, unless it’s part of the project.
For instance, your task might be to analyze data and offer your interpretation and prediction. In that case, you can offer your speculation and point of view, as long as you have evidence to back you up.
8. Use graphics to supplement the text
Avoid writing down a long series of numbers in a sentence. Try using different types of graphs , tables or charts, especially when dealing with a series of numbers.
Here at Piktochart, we have many progress report templates, and the hiring progress report below is a great example.

When using graphs or charts, try out several types to determine which ones best present your data. You might use a bar graph , pie chart , line graph , or even scatter plot . When doing so, though, spend time distinguishing different data sets from the others by using labels and colors.
Don’t worry if this sounds daunting—there are plenty of software that can help you visualize data , including the most basic examples, MS Excel and Numbers for Mac.
How to structure progress report s
You may still be wondering about the exact process of how to write a progress report. Armed with all of these practical tips, how do you put the report together?
First, it depends on the type of report, as well as the intended reader. A progress report may be written daily, weekly, or monthly. It may be written for an individual or a team.
As you’ll see in the examples below, the main parts of a progress report are:
1. Introduction
This part provides an overview of the contents of the progress report. It’s best to write this after you’ve completed all the other parts of the report. That way, you’ll be able to provide an accurate summary.
Keep it short and simple. One or two paragraphs will do.
2. Accomplishments
Numbers and details are your friends, especially when writing this section of the progress report. The accomplishments you write should correspond to your goals.

What were your goals for the period covered by the report?
This could be a goal for the day, week, month, or quarter. On the other hand, it could be a team goal, too.
Be concrete when writing goals. For instance:

Avoid providing too much detailed information. The simpler this section is, the easier it is for stakeholders and the project team to see the project priorities.
4. Roadblocks
Explain what situations, if any, prevented you from achieving your goals, or may have hindered the project’s progress.
But don’t stop there. Be proactive and present an action plan and timeline for resolving the roadblocks. Include details, such as funds, materials, and human resources you may need to implement the solution.
Progress reporting templates you can edit right away
To guide you better, here are progress report template examples that are visually attractive and highly readable.
These templates are available if you sign up for a free Piktochart account . Once you log in, use any of the templates below and edit the elements and text to make it your own.
1. Daily progress report s
A daily progress report includes your goals for the day, as well as your accomplishments the previous day. It also explains challenges encountered in performing tasks and achieving goals.
Another section under the daily report is ‘lessons learned’. These need to be directly related to the day’s tasks and challenges, as well as to the previous day’s accomplishments.

2. Weekly progress report
Weekly progress reports provide a week-by-week breakdown of what has been accomplished and what tasks remain to be completed.
Just like a daily report, a weekly progress report may include challenges and lessons learned. Examples are included in the templates below.
To get a better idea of this, let’s go back to the events example:
- Many potential vendors were attending a week-long industry convention; couldn’t book meetings.
- Potential vendors didn’t read the entire email.

Lessons Learned
- Consider industry events when planning a timeline for contacting clients
- Introductory emails must be short and have readable formatting

3. Monthly progress report ing
A monthly report is necessary for projects with longer durations. The report may provide both monthly and quarterly data on project progress.

4. Team progress report s
Team progress reports provide information on both team and individual milestones and progress status. Now this one is more complicated, simply because it involves several people who may have worked on different tasks.
It’s not enough to just let one person make the report. Of course, one person can do the typing, but everyone must provide input and feedback.
One way to keep a record of different team members’ input is to keep track of edits they have made.
To do this, simply enable tracking of changes on a Word document, or on Pages for Mac users. When working on a collaborative tool like Google Docs , click the pencil icon on the top-right part of the window, and choose “Edits become suggestions” on the drop-down menu. Here’s what that looks like:

On the other hand, team members can insert comments or questions. Again, you can do this easily on a Word document, as well as on software that let you comment on shared documents, like Google Docs and Piktochart .
Here’s what it looks like in Piktochart (learn more about this feature in our guide to annotated comments for teams ):
Here’s one example of Piktochart’s many team project report templates .

One last thing… You’ve finally finished typing up your report—breathe a sigh of relief, but don’t hit ‘send’ just yet.
Go over it at least once (better to do it more than once, especially if it’s a team report). Re-read the article, edit the content as needed, then ask a teammate to proofread with a fresh pair of eyes.

Other Posts

What Color is Vermilion? Its Meaning, Code & Combinations

What Color is Amaranth? Its Meaning, Code & Combinations
What Color is Gamboge? Its Meaning, Code & Combinations
- Product overview
- All features
- Latest feature release
- App integrations
- project icon Project management
- Project views
- Custom fields
- Status updates
- goal icon Goals and reporting
- Reporting dashboards
- asana-intelligence icon Asana AI
- workflow icon Workflows and automation
- portfolio icon Resource management
- Capacity planning
- Time tracking
- my-task icon Admin and security
- Admin console
- Permissions
- list icon Personal
- premium icon Starter
- briefcase icon Advanced
- Goal management
- Organizational planning
- Project intake
- Resource planning
- Product launches
- View all uses arrow-right icon

- Work management resources Discover best practices, watch webinars, get insights
- Customer stories See how the world's best organizations drive work innovation with Asana
- Help Center Get lots of tips, tricks, and advice to get the most from Asana
- Asana Academy Sign up for interactive courses and webinars to learn Asana
- Developers Learn more about building apps on the Asana platform
- Community programs Connect with and learn from Asana customers around the world
- Events Find out about upcoming events near you
- Partners Learn more about our partner programs
- Asana for nonprofits Get more information on our nonprofit discount program, and apply.
- Project plans
- Team goals & objectives
- Team continuity
- Meeting agenda
- View all templates arrow-right icon
- Project management |
- 8 steps to write an effective project s ...
8 steps to write an effective project status report

Effective project status reports are the best way to keep your stakeholders aligned and in the loop during your project progress. These high-level updates proactively let your team know if a project is on track, at risk, or off track—so you can course correct if necessary to hit your deadlines every time. Learn how to create project status reports in a few easy steps, plus check out a template you can use right away.
It’s the end of the week and here you are again: having to dig through a variety of spreadsheets, emails, and tools to patch together an update of how your project is doing.
Instead of manually assembling this information, use a project status report template to streamline this process for you. That way, you spend less time on unnecessary data gathering and more time on work that matters.
Whether you’re gearing up for your first ever project status report or you’re looking for a better system than the one you currently use, this article will walk you through what a progress report is, how you can build one, and how to use project status reports to hit your project deadlines on time, every time. Here’s how.
What is a project status report?
Project status reports are timely updates on the progress of your projects. Written concisely, project reports offer high-level information about project progress, so team members get at-a-glance insight into what’s happening within the project. With a timely status report, you can ensure your entire project team and cross-functional stakeholders understand what’s on track, what’s blocked, and what’s coming next.
Regularly sharing project status reports is important because they help you keep all project stakeholders aligned and informed. They proactively answer questions before team members even have a chance to ask them. A good status report demonstrates progress and builds confidence in the project's direction.
How often you share project status reports depends on your project’s timeline. Some projects benefit from weekly reporting, while others only need to be updated once a month.
Types of status reports
The frequency of project status reports can vary depending on the project timeline, complexity, and stakeholder needs. Choose a schedule that provides timely, concise information without overwhelming your team. Effective reports should be consistent and informative, regardless of the project's health.
Let's explore the four most common types of status reports and their unique benefits.
1. Daily status reports
Daily status reports provide a granular view of a project's progress, ideal for fast-paced projects or those nearing critical milestones. These concise updates typically include:
Tasks completed today
Planned tasks for tomorrow
Any roadblocks encountered
Urgent action items
Daily reports help maintain real-time communication within the project team and quickly identify potential issues before they escalate.
2. Weekly status reports
Weekly status reports are among the most common and effective project status report types. They offer a balanced view of the project's progress without overwhelming stakeholders with too much detail. A typical weekly status report might include:
High-level overview of the project's health (often using color-coding: green, yellow, red)
Key accomplishments from the past week
Upcoming tasks and milestones
Potential risks and mitigation strategies
Updates on project metrics and key performance indicators (KPIs)
Weekly reports are excellent for keeping the entire project team and key stakeholders aligned on the project's current status and short-term goals.
3. Monthly status reports
Monthly status reports provide a broader perspective on the project's progress and are particularly useful for longer-term projects. These reports often include:
Executive summary of the project's overall status
Progress against key milestones and the project timeline
Budget updates and financial metrics
Significant achievements and challenges
Long-term risks and their management strategies
Monthly reports are valuable for updating senior management and external stakeholders who don't require weekly updates but need to stay informed about the project's direction.
4. Quarterly status reports
Quarterly status reports offer a high-level overview of the project's progress over a three-month period. These comprehensive reports are especially useful for large, complex projects or when reporting to executive-level stakeholders. A quarterly status report typically includes:
Project summary and goals
Major milestones achieved and upcoming
Overall project health assessment
Key performance indicators (KPIs) and metrics
Budget status and projections
Risk management updates
Strategic recommendations
Quarterly reports help stakeholders understand the project's progress within the context of the entire project lifecycle and often inform high-level decision-making.
The benefits of effective project status reporting
Reporting isn’t just something you should do for the sake of doing it. Effective reporting has a variety of benefits. When you correctly report on project status, you effectively:
Keep track of project health
The worst thing for a project is when you arrive at the end of the timeline and realize you were off track the whole time. No one likes being blindsided—and as the project manager, you’re empowered to make sure your team is aware of your project health at all times.
Progress reports are a way to do that without too much manual work. Because these reports mix high-level summaries with some important metrics, everyone has a sense of the project's health. And if the project is off track? You can quickly and proactively fix it—so you still hit your project deadline on time and on budget.
Summarize project progress
Project status reports are not real-time reports. These reports are summaries of what happened during the past week, two weeks, or month of project work. They’re an opportunity for your stakeholders to stay informed on how well you’re sticking to the project plan .
If you’re looking for tips on how to report on projects in real time, check out our article on universal reporting tools for every team .
Reduce manual work
As the project manager, you already have enough on your plate. You don’t need to also spend hours every week or month grabbing data from different places. Project reporting tools make it easy to find all of this information in one place, and create a project status report with the click of a button.
Share next steps and action items
Project status reports should go out to your project team, project sponsor, important stakeholders, and cross-functional team members. Because these are high-level reports, they’re appropriate for anyone who wants to stay informed about project progress.
This is the optimal way to let everyone know what’s happening without getting into the details. If there are important project next steps or action items, share them here so everyone knows what to expect.
Proactively identify blockers
If your project isn’t on track, your status report lets others know what the delay is and what you’re doing to resolve any blockers, allowing you to show off your proactive approach to getting things back to where they should be. Similar to the project risk management process , proactive status reporting helps you identify and overcome issues before they impact your project timeline.
Say goodbye to status meetings
The day of the status meeting is over. We now know these aren’t effective ways to spend your time. Unlike face-to-face meetings, project status reports are shared in a central tool that team members can check asynchronously when they want to. They can refer back to the information, or dig deeper into the project if necessary. Save your face-to-face meeting time for valuable meetings like brainstormings or all hands.
Streamline status reporting with work management software
The biggest benefit of project status reporting is that it reduces your manual work, centralizes information, and makes it easy to keep everyone up to date. If your information is scattered across multiple tools, you can’t effectively use project reporting templates—you still need to manually open this Excel spreadsheet and that team email to gather your information.
Instead, make sure you’re using project management software as your central source of truth. With project management software you:
Have a central source of truth so team members can see who’s doing what by when.
Can easily visualize project information in a Gantt chart , Kanban board , calendar, or spreadsheet-style list view.
Create status reports with the click of a button.
Offer a place for team members who read the status report and want more details to look and find the information they need.
Have access to additional project information, like your project plan, communication plan , project goals, milestones, deliverables , and more.
Naturally, we think Asana is a great option. Asana is a work management tool your entire team can use. Your cross-functional collaborators need a way to view past status reports. Your key stakeholders need a bird’s eye view of the entire program or project portfolio management progress. And your team members need a way to track individual work throughout the project lifecycle.
How to write a status report in 8 steps
So, how do you go about doing project status reports? Be sure to create a clear structure you can use consistently for all future status reports. You should also make sure it matches with your project brief to keep your report on topic.
Follow this guide to understand what to include in your project status report, and watch as we put each step into practice with an example of an Employee Satisfaction project.
Step 1: Build your report where work lives
Before you build your report, make sure you’re already tracking your work information in a project management tool. That way, you don’t have to manually grab information from a host of sources—instead, you can reduce manual work and create a report with a few clicks.
Starting off with a project management tool makes it easy to capture dependencies and note upcoming tasks so you’re never blindsided about your project health.
Step 2: Name your report
A great option is to simply use the project name for clarity. If you’re reporting on this project regularly, you should also include a date or timestamp.
Example project report title: February 2020 - Employee satisfaction initiative
Step 3: Indicate project health
The project health is the current status of the project. Project health may change from report to report, especially if you run into blockers or unblock big project risks. Look for a project management tool that allows you to communicate the project’s status and whether or not it’s on track. One way to do this is to use a color coding system (green = on track, yellow = at risk, red = off track).
Example project health update: Project status is on track.
Step 4: Quickly summarize the status report
Your project status report summary should be brief—about 2-3 sentences. The goal here is to give readers who may not have time to read the entire report a quick TL;DR of the most important facts.
This is the first section of your report, so it’s the best place to:
Include highlights
Flag major blockers
Note unexpected project risks
Example status report summary: Our survey results are in and being reviewed. At first glance, we’re seeing 80% employee satisfaction, up 3 points from the last survey. The Engagement Committee is working with the Executive team on what new engagement initiatives to implement in our key target areas, which include career growth and transparency.
Step 5: Add a high-level overview of each key area
Depending on your project, your key areas may vary from report to report, or they may stay consistent. For example, in an Agile project that’s continuously improving, you’d likely use dynamic key areas that cover the things your team worked on during the last sprint. Alternatively, for an event planning project, there are a set number of key areas that you always want to touch on, like promotion, signups, and speakers.
For each key area in the status report, add a few bullet points that give an update on progress, accomplishments, and upcoming work.
Example high-level overview of a key area: Survey results
70% of employees took the satisfaction survey.
Our overall satisfaction rating is 80%.
Only 57% of employees report having a clear path towards career advancement, down 5% since the last survey.
41% of employees listed transparency as the number one improvement they’d like to see.
Step 6: Add links to other documents or resources
While you shouldn’t include every little detail about how your project is going, some people will want to know more. For stakeholders who are looking for more in-depth information, provide links to documents or resources. This can include more specific project information, like links to specific project milestones , or the broader impacts of the project, like a reference to the business goals the project is contributing to.
Example: Include a link to the employee satisfaction survey , as well as to the larger company OKR around increasing employee engagement over the course of the fiscal year.
Step 7: Flag any blockers the project has run into
All projects run into roadblocks. These can come in the form of project risks , unexpected increases to the budget , or delays that impact the project timeline . Keeping stakeholders in the loop when issues arise will help everyone adjust accordingly to stay on track.
Example roadblock: The executive team wants to look at results before the engagement committee meets again, but won’t be able to do so for another three weeks. This will delay our overall project timeline.
Step 8: Highlight next steps
These could include a list of next steps, kudos you want to give someone, or anything else you want to highlight.
Example: Thank you Sarah A. for sending out multiple communications to employees encouraging them to participate in the survey!
Project status report template
To quickly put everything you learned in the previous section to use, write your next project status report using this easy-to-fill-out template:
Report name:
Name your report. This can be as simple as the project name and the date of the report.
Project health:
Is the project on track, at risk, or delayed?
Include a short description of the most important takeaways from your project status report here. Keep in mind that busy stakeholders may only look at this section, so include any highlights or blockers the entire team needs to know about
Key area 1: High-level overview
Specific details about progress, accomplishments, and upcoming work.
Key area 2: High-level overview
Key area 3: High-level overview
Additional information and links:
Link to relevant project details or higher-level project information that stakeholders might be curious about. This section is a chance for team members to dig deeper on specifics, or understand how the project initiative fits into your larger strategic goals .
Are there any challenges you’re facing? How will you resolve them?
Additional notes or highlights:
Are there any additional things your team needs to know? What are the main next steps?
Status report example
While a how-to guide on writing project status reports is helpful, sometimes seeing a real-life example allows you to really see what your own update could look like, right? We thought you might agree, so here’s a status report example you may find useful:
Report name: Ebook launch
Project status: On track
Great progress this week! We are still in the concept phase, but Avery Lomax will be choosing a topic this week. Content and Design teams are standing by and ready to get started once we give the go ahead.
Planning team met to discuss an overall topic
We have three final ideas and will choose one on Friday
A brief is due to the Content team the following Thursday
The Content team is ready to start writing copy as soon as our idea is finalized
They are gathering pertinent company information that should be included
Design reviewed five ebook examples to determine the style they liked
They will be choosing a template by next Tuesday
Jen is out of the office all next week so please direct any content questions to Joy
Thank you to Henry for curating a huge list of topics for us to choose from!
Issues/challenges:
The e-book’s deadline is tight, as we all know. It’s critical that we’re all working in our project management tool to keep everyone organized and on track. Thanks!
Streamline status reporting with a work management tool
The above report is clear and easy to follow. By building this report in a work management tool like Asana, you can automatically fill each section but the summary. Here’s what the above report looks like in Asana:
![[Product UI] Example Asana project status report for an ebook launch meeting (Status Updates)](https://assets.asana.biz/transform/f4db2f8c-dc13-47b9-86ae-b8835fccb5ac/inline-how-project-status-reports-1-2x?io=transform:fill,width:2560&format=webp "update research progress")
Project status reporting best practices
Now you know what to include in your project status report, but you may still have a few additional questions. As you’re creating status reports for your project, these best practices will help you formulate a winning update.
How often should you report out?
The frequency with which you send project updates depends on the type of project you’re running. If your project has a short timeframe, or if things are moving quickly, aim to send weekly project status reports. Alternatively, if the initiative you’re reporting on is a long-term project, you probably only need to send biweekly or even monthly reports. The most important thing is making sure your project stakeholders are up to date.
When you use a project reporting tool, you can set a task for yourself to always send status reports on a certain day each week. These recurring reminders make it easy to keep stakeholders informed, whether you're sending weekly status updates or monthly progress reports. Either way, stakeholders will begin to expect your updates, which means less frequent check-ins from them (plus they’ll appreciate always being in the loop).
By sending regular reports, you can avoid multiple meetings related to a project (we all know unnecessary meetings have their own reputation ). Skip the check-in meetings and save your time for more important work.
Who should you include?
It depends on the project and who is involved, but typically plan to send an update to any stakeholders working on your project. You should have created a stakeholder analysis—outlining all stakeholders, sponsors, and team members—during the project planning process, but refer to your project plan if you aren’t sure.
Even if that week’s status report doesn’t affect a particular team member, you should still share it with everyone. It’s important for everyone to have a high-level overview. Team members who don’t need to review the report in depth can quickly skim your summary section, while others who are more involved can dive into the details you’ve provided.
How detailed should you get?
A project status report shouldn’t offer every little detail. Let the work tell the story—you’re simply curating information and adding a little color. Think of a project status report as a top line message—just the most important pieces of your project that affect most stakeholders should be included.
You should always indicate whether the project is on track, at risk, or off track, give a quick summary of what’s complete and what’s upcoming, then link out to other resources for people who want more details.
Essential components of a status report
A well-crafted project progress report should include the following key elements, which you can customize based on your project's specific needs and the desired level of detail:
Project details: Begin with a high-level overview of the project, including its name, goals, overall scope, and position within the larger project roadmap.
Current status: Provide a concise update on the project's current state and recent accomplishments, showing its alignment with the project plan and timeline. Specify the reporting period to give context to the information presented.
Key metrics and KPIs: Include relevant performance indicators that demonstrate the project's progress. These could be quantitative measures like project budget utilization, task completion rates, or other project-specific metrics. Consider using graphs to visually represent trends and make the data more digestible.
Milestones: Highlight completed milestones and upcoming key project milestones. This helps stakeholders understand both recent achievements and what to expect next in the project life cycle. Relate these milestones to the overall project workflow.
Risks, blockers, and issues: Identify any potential roadblocks, dependencies, or challenges that may impact the project's success. Be sure to include proposed mitigation strategies or action items to address these concerns.
Next steps and action items: Outline upcoming tasks, assignments, and deadlines. This gives team members and stakeholders clarity on what to expect in the near future and helps maintain project momentum.
Remember, an effective status report balances the need for detailed information with clarity and brevity, making it easy for readers to quickly track progress.
Where should you write your project status report?
The best way to draft and share status updates is with a work management tool . Look for a tool that offers an overview of your project, so your team has a central source of truth for all project-related work. That way, instead of managing projects in spreadsheets , you can keep it all—status updates, project briefs, key deliverables, and important project milestones—in one place. Your reports will be easily shareable, and stakeholders can look back on previous reports at any time, avoiding email overload on your end.
![[Product UI] Example Asana Project Overview for a product marketing launch project (Project Overview)](https://assets.asana.biz/transform/b98ec6f2-2167-42f3-8bb5-4c7964970294/inline-how-project-status-reports-2-2x?io=transform:fill,width:2560&format=webp "update research progress")
Wrapping your project up with an executive summary
The status reports we’ve been talking about are always sent during a project to keep everyone in the loop. However, once the project is finished, it’s smart to send out a final summary report. Think of this as the executive summary for your project. This is your chance to offer stakeholders a wrap-up to the project. Use it to officially close it out.
Again, it’s a high-level overview, but instead of including updates and statuses, you’ll provide a summary of how the overall project went. Here are a few questions to answer in a project summary report:
What were the goals of this project and were they met?
Was the project completed on time and on budget (if applicable)?
What successes should be highlighted?
What challenges did we run into?
What can we learn from this project to help us on future projects?
Keep every stakeholder on track with status reports that write themselves
If you’re looking to over-deliver on your next project, try sending project status updates. They keep you productive, efficient, and accountable, while giving everyone else a quick (and engaging) look into what’s been happening.
Use the resources we’ve provided to create reports that give just enough information without diving into too much detail. Find a project management solution like Asana that has features designed specifically to help with status reports. You’ll save time and be as organized as possible.
Related resources

Everything you need to know about requirements management

Gartner® Magic Quadrant™ for Adaptive Project Management and Reporting

How Asana drives impactful product launches in 3 steps

Waterfall, Agile, Kanban, and Scrum: What’s the difference?
Masks Strongly Recommended but Not Required in Maryland
Respiratory viruses continue to circulate in Maryland, so masking remains strongly recommended when you visit Johns Hopkins Medicine clinical locations in Maryland. To protect your loved one, please do not visit if you are sick or have a COVID-19 positive test result. Get more resources on masking and COVID-19 precautions .
- Vaccines
- Masking Guidelines
- Visitor Guidelines
Division of General Internal Medicine
Research-in-progress (rip): tips.
Making the Most of RIP
Powerpoints by Fellowship Alumna, Neda Ratanawongsa, MD, MPH
What is RIP?
A forum where fellows can talk about their research idea, designs, and results and get feedback in an informal, comfortable setting.
At what stages of my research can I present?
All stages: starting a project, planning the design, analyzing the data, or getting ready to present your results at conferences or in manuscripts.
Why are we talking about this?
- Different objectives (& skills) for presenting research-in-progress vs. completed work
- Necessary to do this throughout your career
- It doesn’t have to be scary – can it even be enjoyable?!
- We want to encourage you to present often and feel more comfortable each time.
Setting Your Objectives
You will never get through as much as you thought you would – set a reasonable agenda.
Starting a research project
- Present what’s been done
- Identify the gap(s) in the literature
- Present/refine your conceptual framework
- Identify possible research questions/hypotheses
- Discuss pros/cons of research methodologies
- Identify potential datasets
- Solicit ideas on mentors/collaborators/funding sources
Research design or data analysis
- Briefly present what’s been done as it affects your design
- Identify your specific aim(s) and hypotheses
- Present your research design
- Focus on 1-2 issues / dilemmas – for example: Research design: • Are these appropriate inclusion / exclusion criteria? • How can I improve recruitment? • Please pilot my questionnaire. • How can I get my protocol through the IRB? • How can I collect data on other variables in my conceptual framework? Data analysis: • Do the variables in my model make sense? • Here’s an interesting finding – what do you think of my conclusions? • Are there other confounders I haven’t considered?
Presenting for conferences
- Explain the venue / audience / constraints for your future presentation
- My talk is too long.
- I talk too quickly.
- Do my slides make sense?
- I’m worried about fielding questions.
- Present as if you are at the conference (including Q&A time afterwards)
- Allow ample time to get feedback on the style, content, and your responses in Q&A
10 Ways to Make the Most of Your RIP Presentation
1. Present early and often.
- Better to reconsider your design before submitting the IRB, collecting data, or writing the manuscript
2. Present weeks or months before key deadlines.
- You'll be more willing to incorporate major changes and have time to present again
3. Invite faculty.
- Ask your mentor(s) to come.
- Invite faculty who are not working with you but who have experience with the methodology / content (use your mentors to help you identify and invite them)
- Allow enough lead time so you can coordinate with faculty schedules
4. Prepare for 20 minutes/20 slides.
- Allow enough time for questions while you present and discussion after
- Avoid the temptation to present lots of background
- Go over your slides and objectives with your project mentor in advance to optimize the structure of your talk
5. State upfront and explicitly your (one to three) objectives for the session (see above). 6. Consider how to manage your audience when they:
- If they question something upstream of your objective (e.g. research design), go with the flow for a period of time,
- But redirect your audience back to your objectives when necessary: "These are all great points, but I’d like to move on to …"
- You can ask the audience to hold questions during part/all of your talk,
- But try to practice managing interruptions (which may occur at a conference or job talk): "That’s an important question, and I think my next few slides will address that issue. If I don’t, please remind me to come back to that before we end."
7. Convert comments into constructive criticism.
- "That's a great point that I've struggled with - do you or does anyone else have suggestions on how I could do this differently?"
- Let the audience know in advance the type of feedback you want (content vs. style)
8. Assign a note-taker.
- Save your energy for thinking about and fielding questions
- Have someone bring a laptop to write down what others say and how you respond to their comments / questions
9. Set time aside that day to process the feedback.
- Look over the notes and/or talk about them with your project mentors
- Don’t necessarily act on every suggestion, but keep track of why you don’t (great for anticipating questions at future presentations and writing the limitations section)
10. Solicit feedback on how you present.
- Assign someone to take notes on how you can improve your format, speaking style, responses to questions, the way you redirect the audience
- Hand out a form asking for feedback on both content and presentation style.
When You’re Not Presenting in RIP
- You will learn by hearing others’ critiques and suggestions.
- You will learn by thinking critically about other presentations.
- Better to hear from a variety of viewpoints.
- If you don’t understand something from the presenter or from an audience member, chances are that someone else doesn’t understand either.
- You don’t have to have an answer to a concern that you raise; someone else may have one.
- Better to receive constructive criticism here now than everywhere else later.
- Consider writing down suggestions that don’t relate to the session’s objectives and are not immediately pressing.
Research Progress Report
Report generator.

Progress reports . You heard of them, you may even think they are useful or useless. You may also think that as a student, you don’t have to write them. However, this is not always the case. A research progress report is nothing short as one of the necessary reports you need to make. When it comes to writing reports, a lot of students may feel the need to complain due to the fact that writing reports can be boring or simply a waste of time. What they don’t know is that giving a report is useful for their professors, especially when it is used as a way to know the progress of their performance, school projects, or research activities. So take a good look at these examples to help you out with your research progress report.
10+ Research Progress Report Examples
1. research progress report template.

- Google Docs
2. Summer Stipend Research Progress Report

Size: 31 KB
3. Biomedical Research Progress Report

Size: 150 KB
4. Research Performance Progress Report

Size: 76 KB
5. Weekly Research Progress Report

Size: 103 KB
6. Printable Research Progress Report

Size: 681 KB
7. Research Fellow Progress Report

8. Human Research Progress Report

Size: 117 KB
9. Editable Research Progress Report

Size: 113 KB
10. Candidate Research Progress Report

Size: 290 KB
11. Annual Research Progress Report

What Is a Research Progress Report?
The progress of your research . Whether that progress will be a lot or not as much. The report consists of the detailed progress you give to your superior or for students’ cases to their professors on how their research assignment or research project is going. In addition to that, a research progress report not only consists of the exact progress, but it also consists of what you have been doing, how the research is going, and of course the information you are going to be giving or the evidence whether positive or negative. Everything is written there. A research progress report is a document that clearly states what it is supposed to state.
How to Write a Research Progress Report?
To write a research progress report , there are a lot of ways to do so. Regardless of how you plan it out, draft it out and finalize it, there are still some things you have to think about when you want to proceed. Here are some tips that will get you started with your research progress report.
1. Write the Title of Your Report
The title of your report should at least be about what your research is about. It does not have to be something too fancy that the whole point of the report is lost or too obvious that would make the report redundant.
2. State the Achievements That Have Been Done
Any achievement that has been done or recorded should be written down, no matter how minuscule or large these achievements are. Progress is progress and it should also be recorded.
3. State the Name of the Researchers
The researchers names should also at least be a part of the report, especially if it is a group research. It is always best to add the names of the people involved in helping you with the progress of your report or the progress of your research. Give them some credit.
4. Give the Expected Publication for the Research
There are some who may be asking for the expected publication of your research . If this were the case, at least give the expected date of the research; however, as for the report, when you are done writing it, you should immediately check if you have everything written for it to be presentable.
5. Add the Statistics and Evidence to Support Your Report
The statistics and evidence to support your report should also be present. The reason for having to add evidence for a progress report is to show your professors or your superiors enough to compare the previous progress reports to the current report, regardless if there is any progress or the lack of it.
What is a research progress report?
A research progress report is a document that summarizes the progress of a research made by students. In order for their professors to know the exact ongoing of their research, the students are tasked to write about what is going on with their report and how far are they to achieving it.
Are there other ways to write a research progress report?
There are other ways, but the most common is writing it in an essay form. Of course, you can also fill out a form that states a research progress report form. But it is usual to present it in paragraph form in order for your professors to see the details of the statistics given.
Is a research progress report short or long?
A general research progress report is expected to be a page long. However, this would depend on how much progress you have made throughout your research and how much reports you have done in order to compare from your previous ones.
We are taught to write progress reports while we are still in school, so when we are out there in the real world, we are able to understand the reason and the purpose of writing these kinds of reports. A research progress report is simply just another kind of progress report that we are taught to write. It helps your teachers know where your progress is at the moment and how long are they going to expect your research project to be completed.
Text prompt
- Instructive
- Professional
Generate a report on the impact of technology in the classroom on student learning outcomes
Prepare a report analyzing the trends in student participation in sports and arts programs over the last five years at your school.
- Link to facebook
- Link to linkedin
- Link to twitter
- Link to youtube
- Writing Tips
How to Write a Progress Report

6-minute read
- 28th September 2021
A progress report is a business document that provides updates on a project’s progress toward meeting a goal. Typically, you’ll provide a progress report for a supervisor/manager, team member, or business client to summarize a project’s status and what still needs to be completed or improved.
But how do you write an effective progress report for your business’s projects ? In our guide below, we set out the typical structure of a progress report.
1. Header Information
A progress report should start with a header that includes key details about the report and the project. Typically, this will include the:
- Reporting period and/or the date of submission.
- Name(s) and position(s) of the report’s recipient(s).
- Name(s) and position(s) of the report’s author(s).
- Subject or title of the report/project.
This will help the recipient to understand the contents of the report at a glance.
2. Introduction
The introductory paragraph of a progress report should outline the purpose and timeframe of the project, plus any other important details or insights.
You can also include an overview of what the rest of your progress report will cover.
3. Work Completed
The next section of your report should be titled “Work Completed.” Here, you can provide a chronological list of the project tasks that you have already completed and their corresponding dates. You can also include key findings from those tasks.
4. Problems Encountered
The next section should outline any problems encountered in the project so far. You should then explain either how those problems were solved or how they will be solved, and whether any extra help will be required to do so. You will also need to mention if those problems prompted any changes to the project.
5. Future Plans
To highlight the goals for the remainder of the project, the next section of your report should outline any future project tasks with their corresponding dates or deadlines, anticipated problems, and/or ideas for the project as you move forward.
End your progress report with a brief summary of key completed tasks, ongoing tasks, and major issues encountered. You don’t need to go into too much detail here, though. Stick to the essential details.
5 Tips on How to Write a Progress Report
We also have some helpful tips you can use when writing a progress report:
- Adapt the structure – While the structure outlined above will work for most projects, you can adapt it to suit your requirements. For instance, for a complex project with multiple goals, you may need to break it down into sections, detailing the progress, problems, and plans for each objective.
- Choose an appropriate frequency – For ongoing progress reports, think about whether to schedule daily, weekly, or monthly updates.
- Write clearly – Make sure to write clearly and concisely . Keep your sentences simple, straightforward, and easy to understand.
- Know your audience – If you’re writing a report for someone outside of your organization or team, explain any industry-specific language you use.
- Keep it professional – Make sure to use a formal tone , avoiding colloquial terms and phrases, slang, contractions, and other informal language.
Finally, to be sure your report looks and sounds professional, have it proofread. You can try our proofreading services by uploading a trial document for free today!
Example Progress Report
To see what a progress report might look like, check out our example report below:
Find this useful?
Subscribe to our newsletter and get writing tips from our editors straight to your inbox.
Date: September 24, 2021 To: J. Seymour, Head of Planning From: A. Boleyn, Planning Assistant Subject: Migration to new planning software
Since November 2016, Exemplar Inc. has used the PlanULike package to manage the company’s everyday operations. However, when we expanded to new territories in July 2021, the limitations of the software became evident, especially with regard to currency conversions when budgeting for projects in Europe. As a result, in August 2021, the decision was made to migrate to new planning software. This report covers the progress in this project made up until September 24, 2021.
Work Completed
- August 30 – Research completed into available planning software packages. The PlanZone software is selected based on its flexible budgeting capabilities.
- September 6 – A timeline is developed for installation and implementation of the new software package, with an initial deadline of September 30.
- September 10 – Head of Human Resources, Jack Thacker, begins developing in-house instructional materials for the new software.
- September 18 – Software is acquired and installed. Provisional version of internal training program is developed and tested with key staff members.
- September 21 – IT department identifies software compatibility problems with older hardware in operations department. New equipment purchased.
- September 24 – New computer hardware installed. After testing, training program is extended to heads of department in planning and operations.
Problems Encountered
The key problem encountered thus far has been a compatibility issue between the new software and some of the company’s existing hardware. Head of IT, Simon Robinson, reports that this was due to PlanZone including graphical features that Exemplar Inc. does not use and had not been factored into the initial planning.
Due to speedy delivery and installation of new hardware, this has not significantly affected the timeframe for the migration. But the unexpected expense does mean that the project is now significantly over budget.
In addition, the testing of the in-house training program took longer than anticipated to complete. Key staff are now familiar with the new software, but the deadline for company-wide training has been extended to November 15, 2021.
Future Plans
The improved training program will continue until November 15, 2021, when all relevant staff are expected to be familiar with the new software, after which all operational planning will use PlanZone, and the PlanULike systems will be deprecated by November 30, 2021. Due to exceeding the budget allocated for this project, a meeting will be scheduled for heads of department to discuss how the extra expenses may impact budgeting for other projects.
The company has acquired and installed new planning software (PlanZone), which is projected to enhance project planning and ease operations in new territories. However, unexpected hardware and training issues have slowed progress. Deadlines for the migration have thus been extended. Meanwhile, implications of the extra expenses will be factored into budgeting for upcoming projects.
Share this article:
Post A New Comment
Got content that needs a quick turnaround? Let us polish your work. Explore our editorial business services.
5-minute read
Free Email Newsletter Template
Promoting a brand means sharing valuable insights to connect more deeply with your audience, and...
How to Write a Nonprofit Grant Proposal
If you’re seeking funding to support your charitable endeavors as a nonprofit organization, you’ll need...
9-minute read
How to Use Infographics to Boost Your Presentation
Is your content getting noticed? Capturing and maintaining an audience’s attention is a challenge when...
8-minute read
Why Interactive PDFs Are Better for Engagement
Are you looking to enhance engagement and captivate your audience through your professional documents? Interactive...
7-minute read
Seven Key Strategies for Voice Search Optimization
Voice search optimization is rapidly shaping the digital landscape, requiring content professionals to adapt their...
4-minute read
Five Creative Ways to Showcase Your Digital Portfolio
Are you a creative freelancer looking to make a lasting impression on potential clients or...
Make sure your writing is the best it can be with our expert English proofreading and editing.
Home > AACR Cancer Progress Report > AACR Cancer Progress Report 2023: Contents > Advancing the Frontiers of Cancer Science and Medicine
- Advancing the Frontiers of Cancer Science and Medicine
In this section, you will learn:
- Researchers are harnessing the knowledge of the cellular and molecular underpinnings of cancer initiation and progression to develop safer and more effective treatments for cancer.
- Advances in novel and innovative approaches to surgery, radiotherapy, chemotherapy, molecularly targeted therapy, and immunotherapy—the five pillars of cancer treatment—are saving and improving lives.
- From August 1, 2022, to July 31, 2023, FDA has approved 14 new anticancer therapeutics and two new imaging agents and has expanded the use of 12 previously approved anticancer therapeutics to treat additional cancer types.
- Included in the FDA approvals are the first antibody–drug conjugate for the treatment of ovarian cancer, several new molecularly targeted therapeutics and immunotherapeutics to treat rare cancers including blood cancers, two new immune checkpoint inhibitors, and a first of a kind gene therapy to treat bladder cancer.
- While these exciting new advances have the potential to transform patient care, much work is needed to ensure equitable access to these treatments for all populations.
Clinical Research
Progress across the clinical cancer care continuum, advances in cancer treatment with surgery, improvements in radiation-based approaches to cancer care, advances in treatment with cytotoxic chemotherapy, advances in treatment with molecularly targeted therapy.
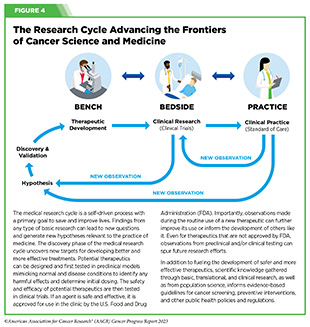
Progress across the continuum of cancer research and patient care improves survival and quality of life for people around the world. In the United States, the annual decline in overall cancer death rate among men, women, children, and adolescents and young adults has accelerated over the past two decades (see Cancer in 2023 ) ( 325 ) Cronin KA, et al. (2022) Cancer, 128: 4251. [LINK NOT AVAILABLE] . This progress is driven by the dedicated efforts of individuals working throughout the cycle of medical research (see Figure 4 and Sidebar 25 ).
The rapid pace of progress against cancer is attributable in part to the new and effective treatments that are available today, thanks to the discoveries made through decades of research in basic and translational sciences. These discoveries have deepened our understanding of the cellular and molecular underpinnings of cancer initiation and progression and led to the identification of a range of molecular targets that drive cancer (see Understanding the Path to Cancer Development ). After a potential therapeutic target is identified, it takes many more years of preclinical research before a candidate therapeutic is developed and ready for testing in clinical trials (see Sidebar 26 ).
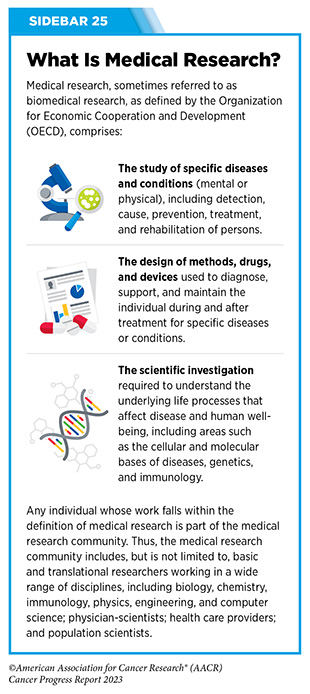
Clinical trials evaluate the safety and efficacy of candidate agents before a preventive intervention or therapeutic can be approved by FDA and used as part of patient care. All clinical trials are critically reviewed and approved by institutional review boards before they can begin and are monitored throughout their duration. There are several types of cancer clinical trials, including prevention trials, screening trials, treatment trials, and supportive or palliative care trials, each designed to answer different research questions (see Sidebar 27 ). Clinical studies in which participants are randomly assigned to receive experimental treatment or standard of care treatment are called randomized clinical trials and are considered the most rigorous.
Clinical trials that test candidate therapeutics for patients with cancer have traditionally been done in three successive phases (see Figure 13 ). Observations made during the real-world use of a drug after it is approved by FDA can also be utilized to further enhance the use of that drug. The multiphase clinical testing process requires many patients, takes years to complete, and has a high rate of failure, making it extremely costly and one of the main barriers to rapid translation of scientific knowledge into clinical advances ( 326 ) Arfe A, et al. (2023) J Natl Cancer Inst, 115:917 [LINK NOT AVAILABLE] ( 327 ) Shadbolt C, et al. (2023) JAMA Netw Open, 6: e2250996. [LINK NOT AVAILABLE] . Identifying and implementing more efficient clinical development strategies are an area of extensive investigation for all stakeholders in medical research (see Sidebar 1 ).
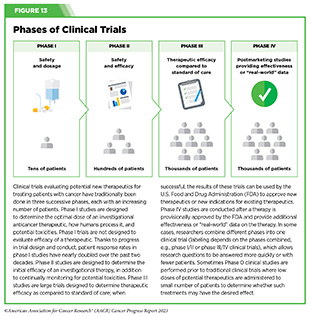
Advances in the understanding of cancer biology have enabled researchers from academia and the pharmaceutical industry to develop new approaches to designing and conducting clinical trials. Among the new concepts and designs for clinical trials that have emerged in recent years are the adaptive, main protocol, and platform trials designs ( 329 ) Li A, et al. (2020) Cancer, 126: 4838. [LINK NOT AVAILABLE] . These designs allow researchers to modify aspects of the trial design, if needed, by leveraging the accumulating data, thereby increasing the efficiency of the clinical research process. Main protocol, also known as master protocol design, and platform design streamline clinical development and allow the evaluation of multiple new agents by matching the right therapeutics with the right patients earlier, reducing the number of patients who need to be enrolled in the trial, and decreasing the length of time it takes for a new anticancer therapeutic to be tested and made available to patients.
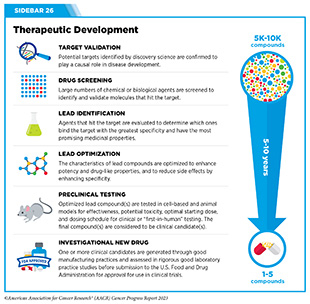
Master protocol can answer multiple clinical questions within a single trial ( 329 ) Li A, et al. (2020) Cancer, 126: 4838. [LINK NOT AVAILABLE] . The emergence of this clinical trial design has largely been driven by accumulating knowledge of the genetic mutations that underpin cancer initiation and growth. As one example, I-SPY 2 is one of the longest-running clinical trials that uses a master protocol which provides the regulatory framework to study multiple treatments for breast cancer within a single study ( 330 ) Quantum Leap Healthcare Collaborative. The I-SPY Trials. Accessed: July 31, 2023. . The platform design of the I-SPY 2 trial allows new treatments to enter and leave the study with a greater efficiency than traditional clinical trials. The study has led to the FDA approval of several breast cancer treatments, including the molecularly targeted therapeutic neratinib (Nerlynx) ( 331 ) Wang H, et al. (2019) Curr Breast Cancer Rep, 11: 303. [LINK NOT AVAILABLE] .
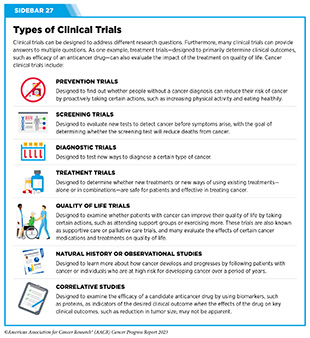
Basket trials are another example of genetic mutation–based master protocol design in clinical trials (see Figure 14 ). These trials allow researchers to test one anticancer therapeutic on a group of patients who all have the same type of genetic mutation, regardless of the anatomic site of the original cancer. As one example, the combination of molecularly targeted therapeutics dabrafenib and trametinib was shown to work against an array of cancer types characterized by a specific genetic feature, or biomarker, called the BRAF V600E mutation, in two recent basket trials including the NCI MATCH study (see Sidebar 9 ) ( 109 ) O’Dwyer PJ, et al. (2023) Nat Med, 29: 1349. [LINK NOT AVAILABLE] . Based on the data from these trials, the combination treatment received FDA approval in June 2022 and is now benefiting many patients with cancer ( 1 ) American Association for Cancer Research. AACR Cancer Progress Report 2022. Accessed: July 5, 2023. . Based on a recent analysis, the use of novel trial designs in clinical cancer research has more than tripled, worldwide, over the past decade ( 332 ) IQVIA. Global Oncology Trends 2023. Accessed: July 5, 2023. .
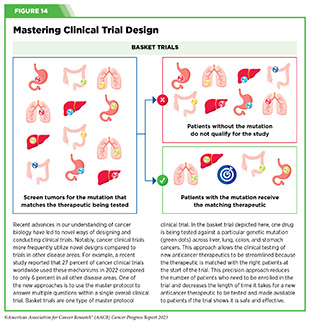
As our understanding of cancer biology continues to evolve and we uncover some of the most elusive questions in cancer medicine (see C ancer Development: Integrating Knowledge ) clinical trial designs will need to evolve as well. Additionally, the design and conduct of clinical cancer research need to keep pace with the new wave of technological advances. Novel designs that integrate emerging approaches such as comprehensive tumor profiling (e.g., of genome, transcriptome, proteome, microbiome, and metabolome, among others), artificial intelligence and machine learning, real-world evidence and data, and leverage inputs from patient advocacy communities and social media platforms will be pivotal to advancing the frontier of cancer clinical trials ( 333 ) Subbiah V (2023) Nat Med, 29: 49. [LINK NOT AVAILABLE] .
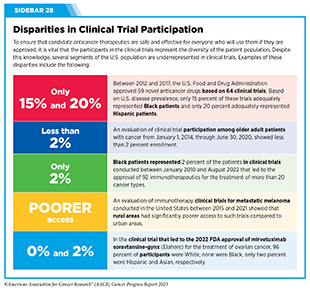
Two of the most pressing challenges that need to be overcome urgently are low participation in cancer clinical trials and a lack of sociodemographic diversity among those who do participate (see Sidebar 28 ). Low participation in clinical trials means that many trials fail to enroll enough participants to draw meaningful conclusions about the effectiveness of the anticancer therapeutic being tested. Lack of diversity in clinical studies means that the trial participant population does not match the actual demographics of the cancer burden under study ( 334 ) In: Bibbins-Domingo K, Helman A, editors. Improving Representation in Clinical Trials and Research: Building Research Equity for Women and Underrepresented Groups. Washington (DC)2022. [LINK NOT AVAILABLE] . Underrepresentation in clinical trials compromises the applicability of such research findings to the entire U.S. patient population.
Understanding and eliminating barriers to clinical trial participation for all segments of the population is vital if we are to accelerate the pace of progress against cancer for everyone. Numerous studies have investigated the existing barriers that limit participation of racial and ethnic minorities and other medically underserved populations in cancer clinical trials. These studies have identified a range of factors such as lack of awareness of clinical trials, financial challenges, limited health literacy, inadequate or complete lack of insurance, medical distrust, implicit biases among health care providers, lack of trial availability, and narrow eligibility criteria, among others ( 13 ) American Association for Cancer Research. AACR Cancer Disparities Progress Report 2022. Accessed: June 30, 2023. . These barriers operate at individual, systemic, and societal levels ( 340 ) Kahn JM, et al. (2022) Cancer, 128: 216. [LINK NOT AVAILABLE] .
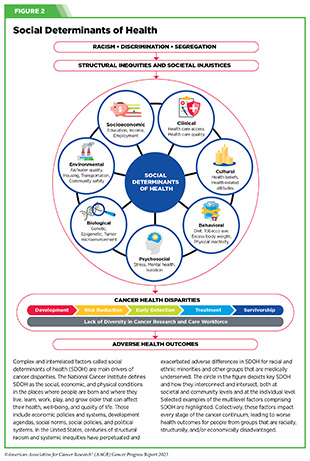
Increased knowledge of the barriers to clinical trial accrual is helping researchers, regulators, and policymakers design and implement evidence-based adaptations that can broaden participant access and promote accrual to clinical research. Such interventions focus on addressing social determinants of health (see Figure 2 ), and include decentralizing many of the trial activities to ease patient participation, expanding eligibility criteria, improving the efficiency of data collection, including patient reported outcomes (PRO), and enhancing community outreach and patient navigation efforts to raise awareness of trials. One critical area of focus for all stakeholders in medical research is fostering greater diversity, equity, and inclusion within the clinical research workforce so the workforce will resemble the patient populations it serves.
U.S. lawmakers and FDA are working on legislation and guidelines intended to increase the diversity of clinical trial participants (see D iversifying and Decentralizing Trials ). These include a diversity action plan which would require researchers and funders of clinical trials to submit concrete goals and needed steps for enrolling specific demographic groups in pivotal studies of new drugs ( 341 ) U.S. Food and Drug Administration. Diversity Plans to Improve Enrollment of Participants From Underrepresented Racial and Ethnic Populations in Clinical Trials; Draft Guidance for Industry; Availability. Accessed: July 5, 2023. . COVID-19, despite its adverse effects on all aspects of cancer research and patient care, enabled researchers to decentralize clinical trial designs, so that lifesaving therapeutics could be brought quickly to as many patients as possible ( 9 ) American Association for Cancer Research. AACR Report on the Impact of COVID-19 on Cancer Research and Patient Care. Accessed: June 30, 2022. . Adaptations implemented by NCI and FDA during the pandemic, including consenting patients remotely, permitting telehealth for routine clinical assessments (see Sidebar 29 ), delivering experimental drugs to patients, and allowing the use of local laboratory or imaging facilities accessible to patients have offered a blueprint of success to further revise and reform clinical trials and the drug approval process for the benefit of all patients with cancer.
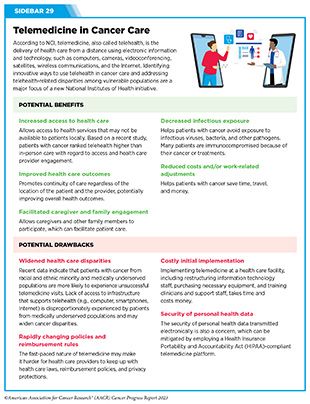
Research discoveries made as a result of innovative cancer science are continually being translated into new medical products for cancer prevention, detection, diagnosis, treatment, and survivorship. The approval of new medical products, including new anticancer treatments, is not the end of a linear research process. Rather, it is an integral part of the medical research cycle (see Figure 4 ) because observations made during the routine use of new medical products can be used to accelerate the pace at which similar products are developed and to stimulate the development of new, more effective products.
New FDA-approved medical products are traditionally utilized alongside treatments already in use, including surgery, radiotherapy, and cytotoxic chemotherapy, which continue to be the mainstays of clinical cancer care (see Figure 15 ). Researchers are also evaluating new ways to refine the use of surgery, radiotherapy, and existing cytotoxic chemotherapeutics to improve survival and quality of life for patients. As one example, a recent clinical trial showed that for patients with early-stage prostate cancer, active monitoring of their disease is a safe alternative to receiving immediate surgery or radiotherapy ( 346 ) Hamdy FC, et al. (2023) N Engl J Med, 388: 1547. [LINK NOT AVAILABLE] . In most cases, prostate cancer grows slowly. Therefore, the study directly compared the long-term outcomes of the three approaches, prostate removal surgery, radiotherapy, or active monitoring and found that there was no difference in prostate cancer mortality at the 15-year follow-up between the three groups. These data provide hope for patients with prostate cancer who opt for active monitoring to avoid treatment-related adverse effects, such as sexual and incontinence problems.
The following sections focus on the recent advances across the five pillars of cancer treatment including the 14 new anticancer therapeutics approved by the FDA in the 12 months spanning this report, August 1, 2022, to July 31, 2023 (see Table 3 and Supplemental Table 2 ). Also highlighted are the 12 previously approved anticancer therapeutics that received FDA approval for treating additional types of cancer in that period.
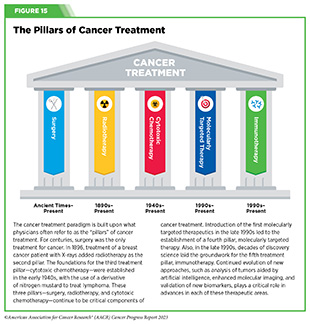
Not discussed are FDA approvals that expand the use of an anticancer therapeutic previously approved for a given cancer type to include treatment with that therapeutic at different timepoints during the course of clinical care or treatment of a different subtype of the same cancer. For example, the August 2022 FDA approval expanded the use of fam-trastuzumab-deruxtecan-nxki (Enhertu), for the treatment of patients with metastatic HER2-low breast cancer that is not removable by surgery. This expansion occurred nearly three years after the molecularly targeted therapeutic was first approved for treating metastatic HER2-positive breast cancer and was based on results from a phase III clinical trial. The study showed that patients with metastatic breast cancer who were treated with fam-trastuzumab-deruxtecan-nxki lived nearly twice as long without their cancer progressing and lived six months longer overall than those treated with standard chemotherapy ( 352 ) Modi S, et al. (2022) N Engl J Med, 387: 9. [LINK NOT AVAILABLE] . Fam-trastuzumab-deruxtecan-nxki is the first treatment approved for patients with HER2-low breast cancer subtype, a newly defined subset of HER2-negative breast cancer.
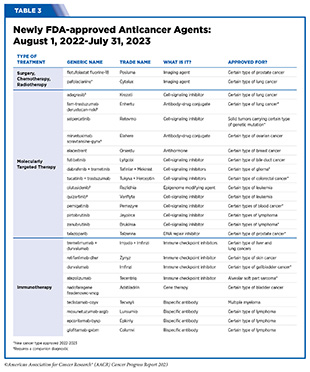
New medical products used across the continuum of clinical cancer care transform lives by improving survival and quality of life. However, not all patients receive the standard of care recommended for the type of cancer with which they have been diagnosed and the stage of cancer at the time of diagnosis (see Sidebar 30 ). Thus, it is imperative that all stakeholders committed to driving progress against cancer work together to address the challenge of disparities in cancer treatment because these can be associated with adverse differences in survival. Recent studies have shown that disparities in survival for prostate cancer or multiple myeloma between Black patients and White patients can be eliminated when both population groups have equivalent access to care and to standard treatments ( 13 ) American Association for Cancer Research. AACR Cancer Disparities Progress Report 2022. Accessed: June 30, 2023. .
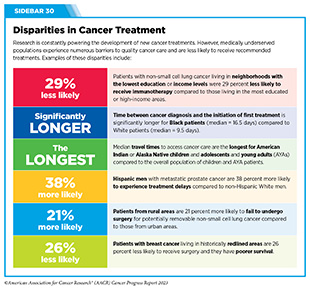
For many years, surgery was the only pillar of cancer treatment (see Figure 15 ). Today, it remains the foundation of curative treatment for many patients. Surgery is used in several ways during the care of a patient with cancer (see Sidebar 31 ).
Sometimes, additional therapy is given before, after, or around the time of surgery based on specifics of a patient’s situation (see Sidebar 32 ). Researchers have found that this approach not only improves the surgeon’s ability to remove the tumor (for example by shrinking the tumor when given before the surgery), but also increases the patient’s overall survival and/or quality of life ( 359 ) Burotto M, et al. (2019) Semin Oncol, 46: 83. [LINK NOT AVAILABLE] .
Improving Quality of Life After a Cancer Surgery
Despite the immense benefits of surgery for the treatment of cancer, complications are common and can negatively affect patient quality of life. Enhanced recovery after surgery (ERAS) programs are emerging as one approach to address this issue. These comprehensive programs focus on optimizing patient care before, during, and after surgery using strategies that ensure the patient is as physically and emotionally fit for surgery as possible; alleviate the stress of surgery; promote recovery; and reduce the time before patients with cancer can begin adjuvant treatment. Providing patients with an individualized plan that includes exercise, nutrition, stress reduction, and smoking cessation to optimize their physical fitness before surgery is one strategy included in some ERAS programs ( 360 ) Gustafsson UO, et al. (2019) World J Surg, 43: 659. [LINK NOT AVAILABLE] ( 361 ) Santa Mina D, et al. (2017) PM R, 9: S305. [LINK NOT AVAILABLE] . The components of ERAS programs can vary depending on the type of surgery being performed and the center at which the surgery is being performed, but overall, these programs have been promising.
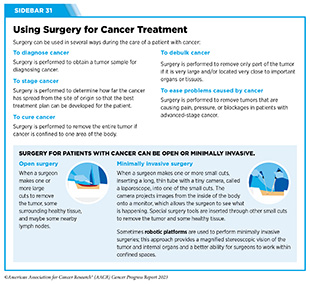
One study found that among patients undergoing surgery for tumors that have metastasized to the spine, those who participated in an ERAS program had reduced blood loss, shorter hospitalization, and significant reduction in opioid pain reliever utilization compared to those who did not participate ( 362 ) Chakravarthy VB, et al. (2022) Cancer, 128: 4109. [LINK NOT AVAILABLE] . Another study showed that among patients undergoing surgery for colorectal cancer, those who participated in an individualized plan that included exercise, nutritional intervention, and psychological support had fewer medical complications and better recovery postsurgery than those who did not participate in such programs ( 363 ) Molenaar CJL, et al. (2023) JAMA Surg, 158: 572. [LINK NOT AVAILABLE] .
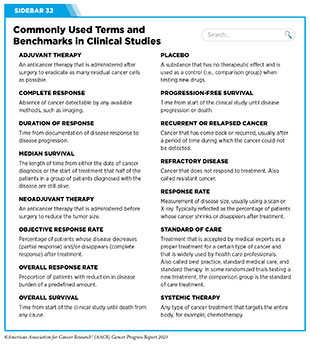
Other approaches to reducing the complications during and after surgery and improving quality of life postprocedure are to perform less extensive and minimally invasive surgeries, such as robotic surgeries or to identify a subset of patients who could skip surgery altogether.
As one example, data from a recent clinical trial showed that for certain patients with early-stage non–small cell lung cancer (NSCLC), surgical removal of only part of the affected lobe of lung is an effective treatment option ( 364 ) Altorki N, et al. (2023) N Engl J Med, 388: 489. [LINK NOT AVAILABLE] . The study, which compared the outcomes of patients who had their entire lobes removed to those who had only the tumor-affected regions removed, showed that the 5-year overall survival was similar in the two groups. While the study participants represent only a select subgroup of patients with lung cancer, these data are important considering that removal of less lung tissue can preserve lung function, especially for older adults and those with compromised lung capacity, such as patients with a prior lung cancer.
Studies have shown that less invasive surgeries may benefit patients since they can minimize postprocedural complications without compromising and sometimes improving long-term outcomes ( 365 ) Topal H, et al. (2022) JAMA Netw Open, 5: e2248147. [LINK NOT AVAILABLE] ( 366 ) Son SY, et al. (2022) JAMA Surg, 157: 879. [LINK NOT AVAILABLE] ( 367 ) Di Benedetto F, et al. (2023) JAMA Surg, 158: 46. [LINK NOT AVAILABLE] . As one example, in a recent clinical trial, patients with locally advanced stomach cancer who underwent a minimally invasive procedure had significantly lower long-term complications after surgery, but similar 5-year overall and relapse-free survival rates compared to those who had open surgeries ( 366 ) Son SY, et al. (2022) JAMA Surg, 157: 879. [LINK NOT AVAILABLE] . Additionally, two retrospective analyses showed improved disease-free and overall survival for patients with pancreatic cancer and reduced morbidity during surgery for patients with liver cancer who underwent minimally invasive surgeries compared to those who received open surgeries ( 365 ) Topal H, et al. (2022) JAMA Netw Open, 5: e2248147. [LINK NOT AVAILABLE] ( 367 ) Di Benedetto F, et al. (2023) JAMA Surg, 158: 46. [LINK NOT AVAILABLE] . Yet another report from an early-stage clinical trial showed that a selected subset of patients with breast cancer who responded remarkably well to neoadjuvant chemotherapy could potentially forgo surgery without risking tumor recurrence ( 368 ) Kuerer HM, et al. (2022) Lancet Oncol, 23: 1517. [LINK NOT AVAILABLE] .
Recent studies have also identified subsets of patients who could skip surgery altogether without compromising outcomes. In a clinical trial, women who had early-stage ( 368 ) Kuerer HM, et al. (2022) Lancet Oncol, 23: 1517. [LINK NOT AVAILABLE] reast cancer with defined clinical characteristics had equally good overall survival whether they received radiotherapy delivered to the lymph nodes in their underarms (axillary radiotherapy), or an invasive surgical procedure to remove these lymph nodes (axillary lymph node dissection) ( 369 ) Bartels SAL, et al. (2023) J Clin Oncol, 41: 2159. [LINK NOT AVAILABLE] . Notably, axillary lymph node dissection is associated with a significantly higher rate of morbidity, particularly lymphedema, which causes swelling in the arms that can cause pain and problems in functioning. These risks are drastically reduced if radiotherapy is given instead and suggests radiation rather than surgery should be the preferred approach in these patients.
While less invasive approaches to surgery such as those described above are promising, before they can become standard of care, it is vital that they are shown in rigorous, well-designed, larger clinical trials to have no adverse effect on long-term patient survival.
Visualizing Lung Cancers More Precisely During Surgery
Lung cancer is the leading cause of cancer deaths in the United States with an estimated 127,070 deaths predicted in 2023 ( 28 ) American Cancer Society. Cancer Facts and Figures. Accessed: July 5, 2023. . While surgery is the standard treatment and provides the best chance to cure early-stage lung cancer, up to 55 percent of people with lung cancer who undergo surgery with curative intent have a recurrence ( 370 ) Uramoto H, et al. (2014) Transl Lung Cancer Res, 3: 242. [LINK NOT AVAILABLE] . Therefore, it is vital that the entire tumor is removed during surgery. Surgeons rely on either imaging tumors before surgery, visually inspecting tumors under normal white light during surgery, or examining tumors by touch to identify cancerous tissue. Unfortunately, some lung lesions can be difficult to visualize, particularly if they are small, beneath the surface of the lung, or a type of lesion characterized by increased opacity of the lung called ground glass opacity, which is being increasingly diagnosed as the rates of lung cancer screenings rise ( 371 ) Migliore M, et al. (2018) Ann Transl Med, 6: 90. [LINK NOT AVAILABLE] ( 372 ) Huang C, et al. (2019) J Cancer, 10: 6888. [LINK NOT AVAILABLE] .
In December 2022, the FDA approved pafolacianine (Cytalux), a folate receptor–targeted fluorescent agent, as the first and only targeted molecular imaging agent that illuminates lung cancers and enhances surgeons’ ability to see cancer in real time as they operate. Molecular imaging using pafolacianine during surgery enables the detection of lung lesions that may have otherwise been missed. Pafolacianine was previously approved to assist surgeons in visualizing hard to detect lesions in adult patients with ovarian cancer during surgery ( 1 ) American Association for Cancer Research. AACR Cancer Progress Report 2022. Accessed: July 5, 2023. . Pafolacianine binds to folate receptors, a protein that is commonly found on the surface of many cancers and illuminates tumor cells under near-infrared light. The agent is administered via intravenous infusion within 24 hours before surgery and assists surgeons in visually identifying additional malignant tissue to be removed during the procedure.
The approval in lung cancer was based on a clinical trial that evaluated the utility of pafolacianine in visualizing tumors in the lungs that may otherwise be undetected with conventional visualization under white light ( 373 ) Sarkaria IS, et al. (2023) J Thorac Cardiovasc Surg. [LINK NOT AVAILABLE] . Molecular imaging using pafolacianine during surgery identified in 19 percent of patients primary lung nodules that surgeons could not find using white light and palpation; additionally, pafolacianine revealed in eight percent of patients additional lesions that were completely missed using white light. The expanded approval of pafolacianine represents a significant advancement in the treatment of lung cancer by enhancing detection of lung tumors during surgery, improving the ability to remove them completely, and reducing the probability of leaving behind cancerous tissue.
Radiotherapy is the use of high-energy rays (e.g., gamma rays and X-rays) or particles (e.g., electrons, protons, and carbon nuclei) to control or eradicate cancer. Discovery of X-rays in 1895 allowed visualization of internal organs at low doses, and the effective use of X-rays at high doses to treat a breast cancer patient a year later established radiotherapy as the second pillar of cancer treatment (see Figure 15 ). Radiotherapy plays a central role in the management of cancer and works primarily by damaging DNA, leading to cancer cell death. The use of radiotherapy in treatment and management of cancer continues to increase, as indicated by a 16.4 percent increase in radiation facilities across the United States between 2005 and 2020 ( 374 ) Maroongroge S, et al. (2022) Int J Radiat Oncol Biol Phys, 112: 600. [LINK NOT AVAILABLE] .
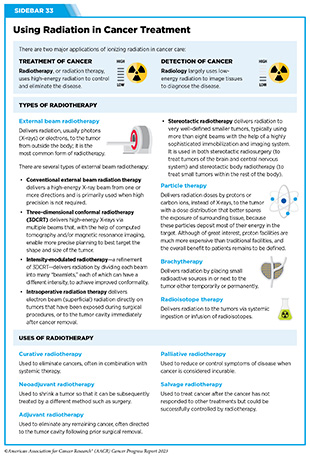
There are many types and uses of radiotherapy (see Sidebar 33 ). However, it is important to note that radiotherapy may also have harmful side effects, partly because of the radiation-induced damage to healthy cells surrounding the tumor tissue ( 375 ) Wang K, et al. (2021) CA Cancer J Clin, 71: 437. [LINK NOT AVAILABLE] .
Researchers are continuously working on making radiotherapy safer and more effective and identifying when radiotherapy can be avoided without affecting the chances of survival for patients. As one example, a recent clinical trial showed that older adult patients with small, early-stage breast cancer may forgo radiation after breast conserving surgery without compromising their overall survival ( 376 ) Kunkler IH, et al. (2023) N Engl J Med, 388: 585. [LINK NOT AVAILABLE] . Traditionally, in these patients, surgery has been followed with radiotherapy to reduce the risk of cancer recurrence. However, radiotherapy can lead to a range of potential side effects including pain, minor risks of organ damage and secondary cancer, as well as time and financial losses. Adverse effects are especially challenging for older adults, many of whom have other comorbidities. The new evidence provides these patients with the option for a less aggressive course of action.
Another clinical trial showed that radiation therapy before initial surgery may not be needed for patients with locally advanced rectal cancer that has spread locally within the rectum but not to other organs ( 377 ) Schrag D, et al. (2023) N Engl J Med, 389: 322. [LINK NOT AVAILABLE] . Traditionally, these patients receive radiation combined with chemotherapy, also known as chemoradiotherapy, before surgical removal of their tumors. Chemoradiotherapy shrinks the tumor making it easier to remove and helping to prevent recurrence. Data from the recent clinical trial showed that chemotherapy alone before surgery was just as effective as chemoradiotherapy at keeping the cancer at bay ( 377 ) Schrag D, et al. (2023) N Engl J Med, 389: 322. [LINK NOT AVAILABLE] .
Researchers are also designing novel radiotherapeutics, to be used alone or in combination with other treatments, to target more cancer types and benefit more patients. Additionally, technological innovations, such as the development of advanced imaging and sophisticated computer analytic programs assisted by AI, are helping optimize the delivery of the radiation to the tumor while minimizing exposure to normal tissues ( 378 ) Santoro M, et al. (2022) Applied Sciences, 12: 3223. [LINK NOT AVAILABLE] . As one example, Magnetic Resonance Imaging (MRI)-guided radiotherapy (MRgRT) is a novel technology with the potential to transform radiotherapy for many patients including those with prostate cancer ( 379 ) Ng J, et al. (2023) Front Oncol, 13: 1117874. [LINK NOT AVAILABLE] . MRgRT provides the ability to image tumors and internal organs with MRI and adapt the radiotherapy plan in real-time while the patient is undergoing the procedure. Unlike traditional radiotherapy, MRgRT allows monitoring of changes in tumor size and positional changes of internal organs during each treatment to achieve a more accurate delivery of the radiation dose. This is particularly critical for rapidly changing tumors and body regions, such as the prostate, where there could be dramatic changes in organ position during each treatment.
Imaging Prostate Cancer More Clearly
Prostate cancer is the most common type of cancer in men in the United States. In 2023, an estimated 288,300 new cases will be diagnosed and 34,700 men will die from the disease.
Prostate cancer that is confined to the prostate is usually treated with surgery or radiation therapy. Unfortunately, many patients with primary prostate cancer have detectable metastases in their pelvic lymph nodes, which are correlated with a risk for cancer recurrence. Surgical procedures known as pelvic lymph node dissection or pelvic lymphadenectomy are used to detect pelvic node lesions, but their use is imprecise and limited to a planned surgical area. An ideal detection method for metastatic prostate cancer would locate tumors in pelvic nodes as well as more distant sites. The more precise a patient’s diagnosis, the easier it is for a health care provider to tailor the treatment to ensure that it is as effective and safe as possible. Notably, despite surgery or radiotherapy many patients with prostate cancer have local or distal recurrences within 10 years.
Among the tools physicians use to make cancer diagnoses is positron emission tomography–computed tomography (PET–CT or PET), a form of imaging that can help physicians precisely locate the position of a patient’s cancer within the body and determine the extent to which the cancer may have spread. Before a PET scan, patients are injected with a radioactive imaging agent. The PET scan detects cancer by identifying where in the body the radioactive agent accumulates.
In May 2023, FDA approved flotufolastat fluorine-18 (Posluma) for PET imaging of PSMA-positive lesions in patients with prostate cancer with suspected metastasis or with suspected recurrence based on elevated serum PSA level. PSA is a secreted biochemical marker that is used to screen individuals for prostate cancer and for predicted recurrence of the disease among patients who have received treatment. PSMA is a protein that is present in abundance on the surface of more than 90 percent of primary and metastatic prostate cancer cells. Flotufolastat F-18 contains a short peptide sequence that binds to PSMA and is internalized by cells that express PSMA. Flotufolastat F-18 also contains the radioisotope fluorine-18 which enables PET imaging of the prostate and other areas of the body where prostate cancer may have spread. Clinicians can use this information to decide which patient should receive treatment and spare others from unnecessary procedures.
Findings from two clinical trials that FDA used to approve flotufolastat F-18 indicate that detection of prostate cancers using this approach may help physicians make the best treatment decisions for patients ( 380 ) The ASCO Post Staff. FDA Approves Flotufolastat Fluorine-18 Injection, First Radiohybrid PSMA-Targeted PET Imaging Agent for Prostate Cancer. Accessed: July 5, 2023. . One study demonstrated a higher specificity of flotufolastat F-18 for the detection of pelvic lymph node metastasis, compared to standard histopathology, in patients with PSMA-positive lesions. Flotufolastat F-18 provided valuable information that would likely result in changes in clinical management for these patients. In the second study, flotufolastat F-18 demonstrated high prostate cancer recurrence detection rates in patients who had suspected disease recurrence based on elevated PSA levels.
Cytotoxic chemotherapy—use of chemicals to kill cancer cells—was first introduced as a pillar of cancer treatment in the early to mid-20th century ( 349 ) DeVita VT, Jr., et al. (2008) Cancer Res, 68: 8643. [LINK NOT AVAILABLE] . Chemotherapy remains a backbone of cancer treatment and its use is continually evolving to minimize potential harms to patients with cancer, while maximizing its benefits.
As with surgery, chemotherapy is more commonly used to treat cancer in combination with one or more additional types of treatments. Furthermore, FDA continues to grant approvals to newer and more effective chemotherapeutics. FDA also routinely expands the use of previously approved chemotherapeutics for additional cancer types through review of new clinical trials as well as by monitoring of current real-world use of such agents. The FDA Project Renewal leverages expertise of clinical researchers to review existing published literature on drug utilization and maintain updated labeling of older, commonly prescribed anticancer therapeutics. As one example of this approach, in December 2022, FDA approved updated labeling for the chemotherapeutic capecitabine (Xeloda) which included new indications and dosing regimens for capecitabine tablets.
Treatment with cytotoxic chemotherapeutics can have adverse effects on patients. These effects can occur during treatment and continue in the long term, or they can appear months or even years later. Health care providers and researchers are investigating different approaches to make chemotherapeutics safer for patients. Areas of ongoing investigation include designing modifiable chemotherapeutics, e.g., with “on” and “off ” switches, that are selectively delivered to tumors while sparing healthy tissue; evaluating less aggressive chemotherapy regimens which can allow patients the chance of an improved quality of life without compromising survival; and identifying biomarkers such as circulating tumor DNA to correctly predict which patients will or will not benefit from chemotherapy, among other approaches ( 381 ) East P, et al. (2022) Nat Commun, 13: 5632. [LINK NOT AVAILABLE] ( 382 ) Rais R, et al. (2022) Sci Adv, 8: eabq5925. [LINK NOT AVAILABLE] ( 383 ) Kotani D, et al. (2023) Nat Med, 29: 127. [LINK NOT AVAILABLE] .
Notably, due to complex reasons, the United States is amid a significant chemotherapeutic shortage. The situation is affecting many patients and disrupting clinical research nationwide. It is imperative that all stakeholders in health care come together and identify ways to address these shortages at the earliest possible time (see Addressing Cancer Drug Shortages ).
Remarkable advances in our understanding of the biology of cancer, including the identification of numerous genetic mutations that fuel tumor growth, set the stage for a new era of precision medicine, an era in which the standard of care for many patients is changing from a one-size-fits-all approach to one in which greater understanding of the individual patient and the characteristics of his or her cancer dictates the best treatment option for the patient (see Understanding the Path to Cancer Development ).
Therapeutics directed to molecules influencing cancer cell multiplication and survival target tumor cells more precisely than cytotoxic chemotherapeutics, which generally target all rapidly dividing cells, and thereby limit damage to healthy tissues. The greater precision of these molecularly targeted therapeutics tends to make them more effective and less toxic than cytotoxic chemotherapeutics. As a result, they are not only saving the lives of patients with cancer, but also allowing these individuals to have a higher quality of life. Unfortunately, because of multilevel barriers to health care, there are disparities in the utilization of molecularly targeted treatments among patients from racial and ethnic minorities and other medically underserved populations ( 13 ) American Association for Cancer Research. AACR Cancer Disparities Progress Report 2022. Accessed: June 30, 2023. . It is vital that ongoing research and future public health policies are aimed to ensure equitable access to precision cancer medicine including tumor genetic testing and the receipt of molecularly targeted therapeutics for all patients.
In the 12 months spanning August 1, 2022, to July 31, 2023, FDA approved seven new molecularly targeted anticancer therapeutics (see Table 3 ). During this period, FDA also approved nine previously approved molecularly targeted anticancer therapeutics for treating additional types of cancer.
Expanding Treatment Options for Patients with Lung Cancer
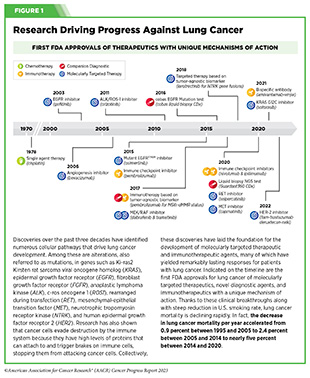
Lung cancer is the second most diagnosed cancer in both men and women and the most common cause of cancer death. More than 127,000 deaths are estimated to occur from the disease in 2023 in the United States ( 28 ) American Cancer Society. Cancer Facts and Figures. Accessed: July 5, 2023. . Decades of basic and translational research have significantly increased our understanding of the genetic changes that drive lung cancer growth and have fueled the development of therapeutics that target these changes (see Figure 1 ) ( 28 ) American Cancer Society. Cancer Facts and Figures. Accessed: July 5, 2023. . Two recent FDA decisions have the potential to drive more progress against lung cancer because they have provided new molecularly targeted therapeutic options for certain patients with the disease.
About 81 percent of lung cancers diagnosed in the United States are classified as non–small cell lung cancers (NSCLC) and approximately 25 percent of patients with NSCLC carry mutations in the gene that is responsible for producing KRAS, an essential protein needed for growth and survival of normal lung cells, but which can contribute to cancer if mutated ( 28 ) American Cancer Society. Cancer Facts and Figures. Accessed: July 5, 2023. ( 384 ) Janne PA, et al. (2022) N Engl J Med, 387: 120. [LINK NOT AVAILABLE] . Mutated KRAS represents one of the most common genetic alterations responsible for the development and progression of human cancers. Patients with NSCLC harboring KRAS mutations often develop resistance to standard treatments such as chemotherapy, radiation therapy, and immunotherapy, and only 25 percent of these patients live five years or more after diagnosis ( 438 ) Voruganti T, et al. (2023) JAMA Oncol, 9: 334. [LINK NOT AVAILABLE] . The most common KRAS mutation in patients with NSCLC is known as KRAS G12C, an alteration that is more frequently found in individuals who smoke currently or have smoked previously. The G12C mutation causes KRAS protein to prefer an “on” or “active” state, leading to uncontrollable cell growth that can form tumors.
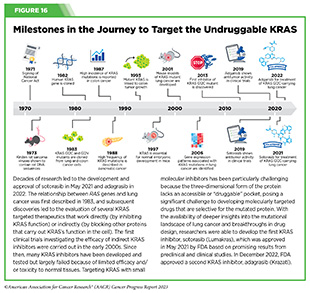
Historically, KRAS has been considered an undruggable target because of the difficulties in designing a therapeutic that could selectively bind and inhibit KRAS in cancers. Despite major breakthroughs in selective targeting of a range of other genetic drivers of NSCLC, no effective treatment options were available for patients with KRAS G12C until two years ago. Thanks to enhanced understanding of KRAS biology and unprecedented progress in structural biology and drug development, in May 2021, sotorasib (Lumakras) became the first ever molecularly targeted therapeutic approved by the FDA for the treatment of patients with NSCLC with the KRAS G12C mutation (see Figure 16 ) ( 4 ) American Association for Cancer Research. AACR Cancer Progress Report 2021. Accessed: June 30, 2023. .
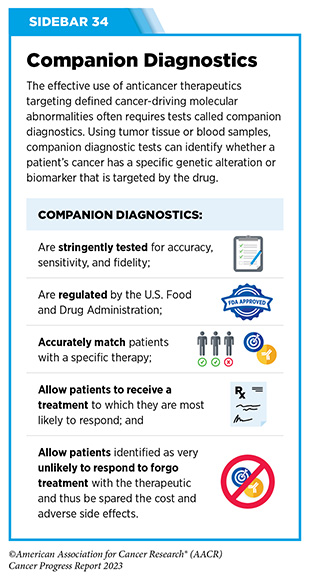
In December 2022, FDA approved a new molecularly targeted therapeutic, adagrasib (Krazati), for adult patients with locally advanced or metastatic NSCLC that has the KRAS G12C mutation, as determined by an FDA-approved test, and who have received at least one prior systemic treatment such as chemotherapy or immunotherapy. The FDA also approved companion diagnostics (see Sidebar 34 ), QIAGEN therascreen KRAS RGQ PCR kit (tumor tissue-based) and Agilent Resolution ctDx FIRST Assay (blood-based) to help identify patients with NSCLC carrying the KRAS G12C mutation. Both sotorasib and adagrasib bind to KRAS G12C protein and lock it in an inactive state thus blocking tumor growth.
The FDA approval of adagrasib was granted after it was shown in a phase II clinical trial that 43 percent of the patients who received the targeted therapeutic had complete or partial tumor shrinkage and continued to respond for a median of 8.5 months without their cancer progressing ( 384 ) Janne PA, et al. (2022) N Engl J Med, 387: 120. [LINK NOT AVAILABLE] . A critical finding from the clinical trial was that adagrasib was able to reach the brains of patients with NSCLC and shrink tumors that had metastasized to the brain ( 385 ) Kotecha R, et al. (2022) N Engl J Med, 387: 1238. [LINK NOT AVAILABLE] . While additional research is needed to confirm therapeutic activity in the brain, these data are extremely encouraging considering recent findings that 27 to 42 percent of patients with NSCLC whose tumors harbor the KRAS G12C mutation may have central nervous system (CNS) metastases at diagnosis, and such metastases are associated with a poor prognosis ( 384 ) Janne PA, et al. (2022) N Engl J Med, 387: 120. [LINK NOT AVAILABLE] .
Another major advance against lung cancer during the 12 months covered in this report is the FDA approval of fam-trastuzumab deruxtecan-nxki (Enhertu) for adult patients with surgically unremovable or metastatic NSCLC whose tumors have a type of mutation in the human epidermal growth factor receptor 2 (HER2) gene, called an activating mutation, as detected by an FDA-approved test, and who have received a prior systemic therapy. The FDA also approved Oncomine Dx Target Test (tissue-based) and Guardant360 CDx (blood-based) as companion diagnostics to test patients for activating HER2 mutations.
HER2-mutated NSCLC, which accounts for three percent of all NSCLC cases, is associated with female sex, never-smoking history, and a poor prognosis. Furthermore, this type of NSCLC has a higher incidence of brain metastases than NSCLC without HER2 mutations or with other mutations ( 386 ) Li BT, et al. (2022) N Engl J Med, 386: 241. [LINK NOT AVAILABLE] ( 387 ) Riudavets M, et al. (2021) ESMO Open, 6: 100260. [LINK NOT AVAILABLE] .
Fam-trastuzumab deruxtecan-nxki is a type of molecularly targeted therapeutic called an antibody–drug conjugate. It comprises a cytotoxic agent, deruxtecan, attached to the HER2-targeted antibody, trastuzumab (Herceptin), by a linker. When the antibody attaches to HER2 protein on the surface of lung cancer cells, the antibody–drug conjugate is internalized by the cells. This leads to deruxtecan being released from the linker and the antibody. Once free, the deruxtecan is toxic to the cancer cells, which ultimately die.
The approval of fam-trastuzumab deruxtecan-nxki was primarily based on the results of a phase II clinical trial in which treatment with the HER2-targeted therapeutic shrank tumors in nearly 60 percent of the study participants ( 388 ) National Cancer Institute. Enhertu Approved for Lung Cancer. Accessed: July 5, 2023. . Among patients whose tumors shrank, the treatment kept their lung cancer at bay for nearly 9 months. While fam-trastuzumab deruxtecan-nxki has previously been approved for the treatment of patients with HER2-driven breast and gastric cancers (4,389), this was the first approval of a HER2-targeted therapeutic for NSCLC and provides new hope for patients with NSCLC who carry an activating HER2 mutation.
Like most cancer treatments, fam-trastuzumab deruxtecan-nxki can have adverse effects, some of which can be severe. One of the most concerning and, in the case of NSCLC, life threatening, is interstitial lung disease which causes stiffness in the lungs, making it difficult to breathe and get oxygen to the bloodstream. Therefore, FDA approved fam-trastuzumab deruxtecan-nxki with a warning for interstitial lung disease and recommends that patients being treated with the molecularly targeted therapeutic be monitored for signs and symptoms of interstitial lung disease, including cough, dyspnea (difficult or labored breathing), fever and other new or worsening respiratory symptoms. If interstitial lung disease is suspected, further testing and intervention must be considered.
While FDA approvals of sotorasib, adagrasib and fam-trastuzumab deruxtecan-nxki are significant advances for patients with NSCLC, all stakeholders in public health need to work together to ensure that every patient has access to and benefits from the latest developments in precision cancer medicine. Patients with lung cancer who receive molecularly targeted therapies have better survival compared to those who do not receive targeted therapies ( 390 ) Goulart BHL, et al. (2021) Clin Lung Cancer, 22: e723. [LINK NOT AVAILABLE] ( 391 ) Lemmon CA, et al. (2023) JCO Precis Oncol, 7: e2200294. [LINK NOT AVAILABLE] . Unfortunately, according to recent data, many patients with advanced NSCLC do not receive appropriate molecular tests or the appropriate molecularly targeted treatments due to gaps in the delivery of clinical care ( 392 ) Osazuwa-Peters OL, et al. (2023) Clin Lung Cancer, 24: 305. [LINK NOT AVAILABLE] ( 393 ) Sadik H, et al. (2022) JCO Precis Oncol, 6: e2200246. [LINK NOT AVAILABLE] .
Targeting Cancers Based on a Common Genetic Feature, Not Tissue of Origin
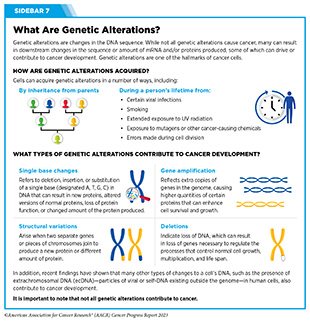
Chromosomal translocations that involve the RET gene and lead to the production of activating RET fusion proteins (see Sidebar 7 ) are rare alterations observed mostly in patients with certain types of thyroid cancer and lung cancer ( 394 ) Duke ES, et al. (2023) Clin Cancer Res: OF1. [LINK NOT AVAILABLE] . In 2020, FDA approved the RET-targeted therapeutic, selpercatinib (Retevmo), for treating patients with metastatic NSCLC and certain thyroid cancers that test positive for chromosomal translocations involving the RET gene ( 389 ) Sengupta R, et al. (2020) Clin Cancer Res, 26: 5055. [LINK NOT AVAILABLE] .
In solid tumors other than lung cancer and thyroid cancer, RET gene fusions are rarer, observed in less than one percent of patients ( 394 ) Duke ES, et al. (2023) Clin Cancer Res: OF1. [LINK NOT AVAILABLE] . However, this is a distinct patient population since RET gene fusions are mutually exclusive of other genetic alterations and provide a unique opportunity for therapeutic intervention ( 394 ) Duke ES, et al. (2023) Clin Cancer Res: OF1. [LINK NOT AVAILABLE] . A recent decision from FDA offers a new treatment option for these patients who until this approval had no molecularly targeted therapeutics available for their cancer.
In September 2022, FDA expanded the approval of selpercatinib for the treatment of adult patients with locally advanced or metastatic solid tumors with a RET gene fusion that have progressed on or following prior systemic treatment or who have no satisfactory alternative treatment options. The approval of selpercatinib was based on the results of a phase I/II basket clinical trial (see Figure 14 ) in which treatment with the RET-targeted therapeutic shrank tumors in nearly 44 percent of the study participants ( 395 ) Subbiah V, et al. (2022) Lancet Oncol, 23: 1261. [LINK NOT AVAILABLE] . Patients with a range of cancer types including pancreatic adenocarcinoma, colorectal, salivary gland, unknown primary, breast, soft tissue sarcoma, bronchial carcinoid, ovarian, small intestine, and cholangiocarcinoma responded to selpercatinib, emphasizing the importance of basket clinical trial designs in driving progress in precision medicine.
Delivering a Cytotoxic Drug Precisely to Ovarian Cancer Cells
In 2023, an estimated 19,710 new cases of ovarian cancer will be diagnosed in the United States, and 13,270 women will die from the disease ( 28 ) American Cancer Society. Cancer Facts and Figures. Accessed: July 5, 2023. . Many patients with ovarian cancer are diagnosed at an advanced stage. Patients with advanced disease are usually treated with platinum-based chemotherapeutics. Although most patients respond initially to platinum-based treatment, nearly 80 percent will experience relapse. Unfortunately, patients with recurrent ovarian cancer are resistant to platinum-based treatments and have a poor prognosis.
Folate receptor alpha (FRα) is a cell surface protein that binds to and transports folate (also known as vitamin B9) into cells. Research has shown that FRα is expressed at much higher levels in advanced ovarian cancer cells, compared to healthy adult tissues ( 396 ) Dilawari A, et al. (2023) Clin Cancer Res, OF1. [LINK NOT AVAILABLE] . There is also emerging evidence, including clinical data, that elevated FRα expression may be associated with lack of response to standard chemotherapy in ovarian cancer ( 397 ) Matulonis UA, et al. (2023) J Clin Oncol, 41: 2436. [LINK NOT AVAILABLE] . These attributes make FRα a promising target for therapeutic intervention in ovarian cancer.
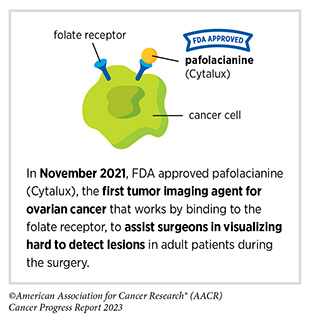
The molecularly targeted therapeutic mirvetuximab soravtansine-gynx (Elahere) targets FRα and, in November 2022, received FDA approval for adult patients with FRα positive, platinum-resistant epithelial ovarian, fallopian tube, or primary peritoneal cancer, who have received one to three prior systemic treatment regimens. FDA also approved the companion diagnostic VENTANA FOLR1 RxDx Assay to identify patients eligible for the therapy.
Mirvetuximab soravtansine-gynx is an antibody–drug conjugate designed to deliver a cytotoxic drug to cells that express FRα. It is the first antibody–drug conjugate to be approved by FDA to treat platinum-resistant ovarian cancer and marks the first FDA approval since 2014 for platinum chemotherapy-resistant ovarian cancer, which is associated with a poor prognosis. The approval was based on results from a phase III clinical trial that enrolled 106 patients. Nearly 32 percent of patients responded to mirvetuximab soravtansine-gynx, with a median duration of response of 6.9 months ( 396 ) Dilawari A, et al. (2023) Clin Cancer Res, OF1. [LINK NOT AVAILABLE] ( 397 ) Matulonis UA, et al. (2023) J Clin Oncol, 41: 2436. [LINK NOT AVAILABLE] . The approval of mirvetuximab soravtansine-gynx is great news for patients, such as Jacly n (Jackie) VanRaaphorst . There is preliminary evidence that mirvetuximab soravtansine-gynx also improves overall survival for this FRα-positive ovarian cancer patient population ( 398 ) Angelergues A, et al. (2023) Journal of Clinical Oncology, 41: LBA5507. [LINK NOT AVAILABLE] .
A common adverse effect of mirvetuximab soravtansine-gynx is ocular toxicity—changes that affect the structure or function of the eye. Therefore, FDA approved mirvetuximab soravtansine-gynx with a warning that patients being treated with the molecularly targeted therapeutic be monitored and treated for signs and symptoms of vision impairment and corneal disorders.
Improving Outcomes for Patients with Metastatic Breast Cancer
Despite major advances in the treatment of breast cancer, it remains the second leading cause of cancer-related death for women in the United States ( ( 28 ) American Cancer Society. Cancer Facts and Figures. Accessed: July 5, 2023. . Recent FDA decisions have the potential to power more progress against breast cancer because they have provided new therapeutic options for certain patients with the disease.
For patients with breast cancer, one factor determining what treatment options should be considered is the presence or absence of three tumor biomarkers, estrogen and progesterone hormone receptors, which drive tumor growth upon engagement with their respective hormones, and the protein HER2. About 70 percent of breast cancers diagnosed in the United States are characterized as hormone receptor–positive and HER2-negative ( 3 ) Giaquinto AN, et al. (2022) CA Cancer J Clin, 72: 524. [LINK NOT AVAILABLE] . Potential treatment options for these patients include the combination of an antihormone therapeutic such as tamoxifen, which works by preventing the hormone estrogen from attaching to its receptor; or letrozole, which works by lowering the level of estrogen in the body; or fulvestrant, which works by destroying estrogen receptors (ER) with a cyclin-dependent kinase 4/6 inhibitor. Treatment with antihormone therapeutics is also called endocrine therapy.
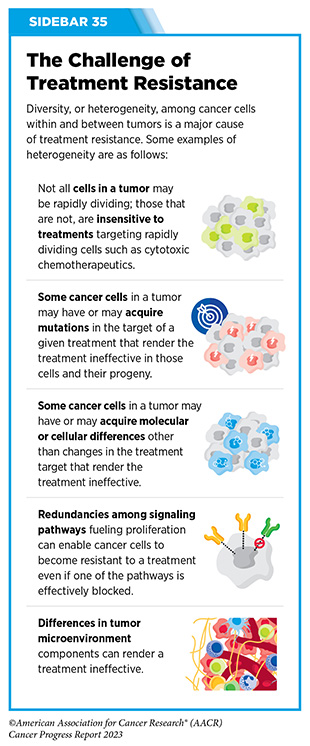
Unfortunately, most advanced, hormone receptor-positive breast cancers that initially respond to endocrine therapy eventually become treatment resistant (see Sidebar 35 ). Resistance to fulvestrant commonly develops due to mutations in ESR1, the gene that encodes the ER protein. Until recently, fulvestrant was the only available FDA-approved treatment that worked by destroying ER. Therefore, patients whose tumors become resistant to it were left with limited treatment options.
The FDA approval of elacestrant (Orserdu) in January 2023 brings new hope to these patients. Elacestrant, which also works by destroying the ER, was approved for postmenopausal women or adult men with ER-positive, HER2-negative, ESR1-mutated advanced or metastatic breast cancer with disease progression following at least one line of endocrine therapy. Unlike fulvestrant, which is delivered through intramuscular injections, elacestrant is administered orally, making it more convenient for patients to receive the treatment. The approval was based on results from a phase III, randomized clinical trial showing that among patients with ESR1 mutations, those treated with elacestrant had a 45 percent lower risk of death or disease progression than those treated with other endocrine therapies ( 399 ) Bidard FC, et al. (2022) J Clin Oncol, 40: 3246. [LINK NOT AVAILABLE] .
Personalizing Treatment for Patients with a Rare Solid Tumor
Rare cancer is defined by the National Cancer Institute as cancer that occurs in fewer than 15 out of 100,000 people each year. Rare cancers can be challenging for researchers to study and for physicians to treat (see Sidebar 36 ). During the 12 months covered by this report, August 1, 2022, to July 31, 2023, the FDA approved molecularly targeted therapeutics and immunotherapeutics for treating several rare cancers, bringing the promise of precision medicine to patients, such as Isabella (Bella) Snow Fraser, p. 110, and Alexis Browning, p. 112, who often have few treatment options.
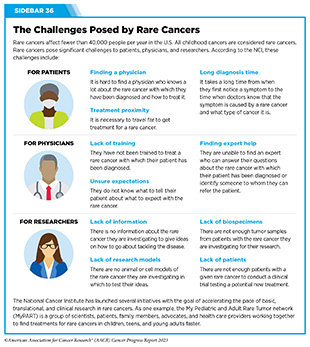
Bile duct cancer, also known as cholangiocarcinoma, is a rare but aggressive disease in which cancer arises from cells in the bile ducts. Cholangiocarcinoma is often diagnosed at an advanced stage. There are two types of bile duct cancer: intrahepatic, where cancer forms in the bile ducts inside the liver; and extrahepatic, where cancer forms in the bile ducts outside the liver. Less than 8,000 new cases of bile duct cancer are estimated to be diagnosed in the United States in 2023 and only a small number of bile duct cancers are intrahepatic ( 28 ) American Cancer Society. Cancer Facts and Figures. Accessed: July 5, 2023. . While rare, the incidence of intrahepatic cholangiocarcinoma is increasing worldwide ( 400 ) Goyal L, et al. (2023) N Engl J Med, 388: 228. [LINK NOT AVAILABLE] . Surgery is the main curative treatment option for patients with intrahepatic cholangiocarcinoma. However, up to two thirds of patients have disease recurrence and patients with intrahepatic cholangiocarcinoma have a 5-year overall survival rate of less than eight percent ( 400 ) Goyal L, et al. (2023) N Engl J Med, 388: 228. [LINK NOT AVAILABLE] .
Alterations in fibroblast growth factor receptor 2 (FGFR2), a protein involved in many cellular processes including multiplication, migration, and survival, are associated with several cancers including bile duct cancers. Nearly 14 percent of patients with intrahepatic cholangiocarcinoma have fusions or rearrangements in the FGFR2 gene (see Sidebar 7 ) ( 400 ) Goyal L, et al. (2023) N Engl J Med, 388: 228. [LINK NOT AVAILABLE] . FDA had previously approved two molecularly targeted therapeutics, pemigatinib (Pemazyre) and infigratinib (Truseltiq), which block the function of FGFR2 proteins, for the treatment of patients with cholangiocarcinoma with confirmed FGFR2 fusions or rearrangements ( 389 ) Sengupta R, et al. (2020) Clin Cancer Res, 26: 5055. [LINK NOT AVAILABLE] ( 401 ) Sengupta R, et al. (2021) Clin Cancer Res, 27: 5757. [LINK NOT AVAILABLE] . While these agents are benefiting many patients with bile duct cancer, their efficacy has been somewhat limited due to the development of treatment resistance ( 400 ) Goyal L, et al. (2023) N Engl J Med, 388: 228. [LINK NOT AVAILABLE] .
In September 2022, the FDA granted approval to a third FGFR2-targeted therapeutic, futibatinib (Lytgobi) for adult patients with previously treated, unresectable, locally advanced or metastatic intrahepatic cholangiocarcinoma that tests positive for FGFR2 fusions or other rearrangements. The approval was based on the results of a phase I/II clinical trial that showed that futibatinib shrank tumors in 42 percent of patients ( 400 ) Goyal L, et al. (2023) N Engl J Med, 388: 228. [LINK NOT AVAILABLE] . The median duration of response was 9.7 months. Futibatinib works differently than pemigatinib and infigratinib and preliminary data indicate that it may mitigate the challenge of treatment resistance since patients who had disease progression after prior FGFR-targeted therapy with other inhibitors maintained sustained clinical benefit with futibatinib ( 400 ) Goyal L, et al. (2023) N Engl J Med, 388: 228. [LINK NOT AVAILABLE] .
Combining Molecularly Targeted Therapeutics to Block Tumor Growth
The BRAF enzyme has a critical role in controlling cell growth. The BRAF gene is altered in approximately six percent of all human cancers, including melanoma and colorectal cancer ( 402 ) Dankner M, et al. (2018) Oncogene, 37: 3183. [LINK NOT AVAILABLE] . Most cancer-related changes in the BRAF gene cause the protein to continuously stay active, thus helping cancer cells grow faster than normal cells. One of the most common cancer-related changes is the BRAF gene is called the BRAF V600E mutation. Presence of the BRAF V600E mutation is associated with poor outcomes for patients with certain types of cancer.
The first time FDA approved the use of two molecularly targeted therapeutics as a combination treatment for cancer was in January 2014 ( 67 ) Arteaga CL, et al. (2014) Clin Cancer Res, 20: S1. [LINK NOT AVAILABLE] . The approval was for the use of dabrafenib (Tafinlar) and trametinib (Mekinist) for treating patients with metastatic melanoma that tests positive for activating BRAF V600E and BRAF V600K mutations. The two therapeutics target different components of the BRAF signaling pathway. Dabrafenib targets altered BRAF proteins containing V600 mutations, while trametinib targets MEK1 and MEK2, which are two proteins that mediate the function of BRAF. By blocking both BRAF and MEK, the combination therapy can more completely and effectively shut down the signaling pathway. The combination was approved after it was shown to almost double the length of time before disease progression compared with dabrafenib alone ( 403 ) Flaherty KT, et al. (2012) N Engl J Med, 367: 1694. [LINK NOT AVAILABLE] .
In March 2023, the same combination of molecularly targeted therapeutics was approved for pediatric patients one year of age and older with low-grade glioma with a BRAF V600E mutation who require systemic therapy. The FDA also approved new oral formulations of dabrafenib and trametinib for pediatric patients who are unable to swallow pills.
Brain and other nervous system tumors are the second most diagnosed cancers in children. Low-grade glioma is the most common type of pediatric brain cancer. Research has demonstrated that BRAF signaling pathway activation is common in pediatric low-grade gliomas. Therefore, the March approval of dabrafenib and trametinib combination therapy brings hope to many parents and families whose children are diagnosed with the disease. FDA approved the combination therapy based on data from a clinical trial showing that a significantly higher percentage of patients who received dabrafenib and trametinib had their tumors shrink compared to those who received the standard of care chemotherapy (47 percent vs. 11 percent, respectively) ( 404 ) Hargrave DR, et al. (2022) J Clin Oncol, 40: 2009. [LINK NOT AVAILABLE] . Patients treated with dabrafenib and trametinib also had a 69 percent lower risk of disease progression, with a progression-free survival of 20 months, compared to seven months among patients receiving chemotherapy ( 404 ) Hargrave DR, et al. (2022) J Clin Oncol, 40: 2009. [LINK NOT AVAILABLE] .
The FDA approval of a second combination therapy during the 12 months covered in the report provides a new and first of a kind treatment option for certain patients with colorectal cancer. The combination of tucatinib (Tukysa) and trastuzumab (Herceptin), both HER2-targeted therapeutics, was approved by FDA in January 2023 for patients with HER2-positive unresectable or metastatic colorectal cancer that has progressed following at least two standard treatments, including chemotherapy. To be eligible to receive the new combination, patients’ tumors must also not have driver mutations in the RAS group of genes.
Colorectal cancer is the second most common cause of cancer death in the United States. An estimated 153,020 people are expected to be diagnosed with colorectal cancer in the United States in 2023 ( 28 ) American Cancer Society. Cancer Facts and Figures. Accessed: July 5, 2023. . Excessive production of the HER2 protein which leads to tumor cell multiplication, invasion, and metastasis is found in approximately three to five percent of patients with metastatic colorectal cancers ( 405 ) Ahcene Djaballah S, et al. (2022) Am Soc Clin Oncol Educ Book, 42: 1. [LINK NOT AVAILABLE] such as that of B rian Beck . The approval of the tucatinib and trastuzumab combination for this patient population was based on a phase II clinical trial which showed that 38 percent of patients who received the drug combination had their tumors shrink or disappear ( 406 ) Strickler JH, et al. (2023) Lancet Oncol, 24: 496. [LINK NOT AVAILABLE] .
Considering that prior treatment options for patients with HER2-positive colorectal cancer that has returned or started growing again after receiving standard treatments were not very effective, the approval of tucatinib and trastuzumab represents a significant breakthrough for this subset of patients with metastatic colorectal cancer. Ongoing studies are evaluating whether addition of tucatinib and trastuzumab to standard treatment regimens could be used earlier on as the initial treatment for metastatic HER2-positive colorectal cancer.
Adding Precision to the Treatment of Blood Cancers
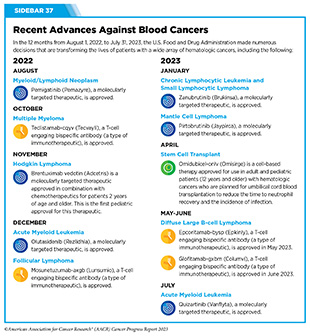
Cancers that arise in blood-forming tissues, such as the bone marrow, or in cells of the immune system, are called blood cancers, or hematologic cancers. In the 12 months covered by this report, FDA has made numerous decisions that are transforming the lives of patients with a wide array of hematologic cancers (see Sidebar 37 ).
Acute myeloid leukemia (AML) is the most commonly diagnosed leukemia in the United States, with 20,380 new cases anticipated in 2023 ( 28 ) American Cancer Society. Cancer Facts and Figures. Accessed: July 5, 2023. . AML has only 32 percent overall 5-year relative survival rate, the lowest among leukemias ( 5 ) Surveillance, Epidemiology, and End Results (SEER) Program. Accessed: July 5, 2023. . Research has substantially increased our understanding of the biology of AML, in particular the different types of genetic mutations that promote AML development. This knowledge is fueling the emergence of molecularly targeted therapeutics for defined groups of patients with the disease.
One of the genes known to be mutated in about seven to 14 percent of AML cases is IDH1 ( 407 ) de Botton S, et al. (2023) Blood Adv, 7: 3117. [LINK NOT AVAILABLE] . Mutation in IDHI gene results in an altered IDH1 protein, which can drive cancer formation by interfering with normal cellular maturation and promote uncontrolled cell multiplication. This knowledge led to the development of ivosidenib (Tibsovo), the first therapeutic to target IDH1, which was approved by FDA in 2018.
In December 2022, FDA approved a second IDH1-targeted agent, olutasidenib (Rezlidhia), for adult patients with AML that has not responded to or has relapsed after other treatments, and that harbors an IDH1 mutation as detected by an FDA-approved test. At the same time that the molecularly targeted therapeutic was approved, FDA also approved the companion diagnostic, Abbott RealTime IDH1 Assay, to identify patients with AML with an IDH1 mutation.
Olutasidenib was approved for the treatment of AML after it was shown in a phase I/II clinical trial that 32 percent of patients treated with the molecularly targeted therapeutic had complete remission, meaning that there was no evidence of disease and full recovery of blood counts ( 407 ) de Botton S, et al. (2023) Blood Adv, 7: 3117. [LINK NOT AVAILABLE] . Not only does the approval of olutasidenib increase treatment options for patients with IDH1-mutated AML, but there is also preliminary evidence that patients may respond longer to olutasidenib compared to the other IDHI-targeted therapy ( 407 ) de Botton S, et al. (2023) Blood Adv, 7: 3117. [LINK NOT AVAILABLE] . A potential side effect observed among patients treated with olutasidenib is differentiation syndrome. The condition is caused by a large, rapid release of immune molecules called cytokines from leukemia cells and can lead to fever, cough, troubled breathing, build-up of excess fluid around the heart and lungs, low blood pressure, and kidney failure, but is generally readily treated with full resolution. The FDA approval is accompanied by a warning highlighting the risk of this potentially fatal adverse effect.
In July 2023, the FDA approved a second new molecularly targeted therapeutic, quizartinib (Vanflyta), for the treatment of AML. Quizartinib was approved for treating adults who have newly diagnosed AML that tests positive for a mutated FLT3 gene known as FLT3 internal tandem duplication (ITD). Mutations in the FLT3 gene promote the multiplication and survival of AML cells in 25 to 30 percent of cases, and patients with this type of AML have particularly poor outcomes ( 408 ) Yanada M, et al. (2005) Leukemia, 19: 1345. [LINK NOT AVAILABLE] . The approval was based on results from a phase III clinical trial showing that patients who received quizartinib had a 22 percent reduced risk of death compared to those who received standard chemotherapy during the course of the clinical study ( 409 ) Erba HP, et al. (2023) Lancet, 401: 1571. [LINK NOT AVAILABLE] . Quizartinib can cause several cardiac adverse effects and is therefore available only through a restricted program.
At the same time that the FDA made the decision about quizartinib, it expanded the use of the LeukoStrat CDx FLT3 Mutation Assay as a companion diagnostic to identify patients with FLT3 ITD mutation–positive AML who are eligible for treatment with the new molecularly targeted therapeutic.
Myeloid/lymphoid neoplasm (MLN) with fibroblast growth factor receptor 1 (FGFR1) rearrangement is a rare, aggressive disease characterized by higher-than-normal levels of certain white blood cells. MLNs do not respond well to standard chemotherapy and can rapidly progress to AML ( 410 ) Verstovsek S, et al. (2018) Ann Oncol, 29: 1880. [LINK NOT AVAILABLE] . FGFR1 is a cell surface protein that stimulates cellular proliferation upon binding with specific extracellular molecules. In rare instances, the FGFR1 gene fuses with another gene (an alteration known as a genetic rearrangement) resulting in a fusion protein that drives the development of MLNs.
Pemigatinib (Pemazyre) inhibits the function of FGFR1 to suppress the growth of FGFR1-driven cancers ( 410 ) Verstovsek S, et al. (2018) Ann Oncol, 29: 1880. [LINK NOT AVAILABLE] and in August 2022, it was approved by FDA for adults with MLNs with FGFR1 rearrangement who have not responded to or have relapsed after other treatments. The approval was based on results from a phase II clinical trial that showed that 79 percent of patients had a complete response to pemigatinib. Therefore, the FDA approval of pemigatinib for adult patients with relapsed or refractory MLNs with FGFR1 alteration is a major milestone for the treatment of patients who are diagnosed with the disease.
Non-Hodgkin lymphoma (NHL) is the most commonly diagnosed blood cancer in the United States. In 2023, 77,240 people in the United States are expected to be newly diagnosed with the disease ( 28 ) American Cancer Society. Cancer Facts and Figures. Accessed: July 5, 2023. . Notably, NHL encompasses many different types of cancer, most of which arise in immune cells called B cells. Two molecularly targeted therapeutics, recently approved by FDA for treating different subtypes of NHL arising in B cells— pirtobrutinib (Jaypirca) and zanubrutinib (Brukinsa)—target a protein called Bruton tyrosine kinase (BTK). BTK was first identified in 1993. Since its discovery, the role of BTK has been studied extensively in blood cancers and inflammatory diseases. Researchers have found that BTK is a key component of a signaling pathway that promotes the survival and expansion of NHL B cells. Consequently, BTK inhibitors have revolutionized the treatment of NHL arising in B-cells, particularly chronic lymphocytic leukemia/small lymphocytic lymphoma (CLL/SLL) and mantle cell lymphoma (MCL) as well as certain inflammatory diseases ( 411 ) Alu A, et al. (2022) J Hematol Oncol, 15: 138. [LINK NOT AVAILABLE] .
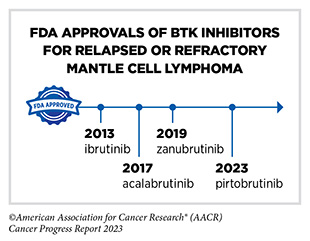
Ibrutinib was the first BTK inhibitor approved by FDA. The approval, in 2013, was for the treatment of patients with relapsed and refractory mantle cell lymphoma (MCL). While the approval of ibrutinib was a major milestone in personalized treatment for B-cell cancers, researchers soon discovered that in patients on continuous treatment with BTK-targeted therapy, cancer cells can acquire mutations in the BTK gene that render the therapeutic ineffective. Since then, newer and more sophisticated BTK inhibitors with improved specificities and thus reduced toxicities have been developed to mitigate the challenge of acquired resistance (see Sidebar 35 ).
Pirtobrutinib (Jaypirca) is a new BTK targeted therapeutic that FDA approved in January 2023 for treating MCL. The agent was approved for patients with relapsed or refractory MCL that has not responded to or has relapsed after another treatment, including a BTK inhibitor. Pirtobrutinib has a unique mechanism of action that makes it effective even against mutated forms of BTK that are resistant to other BTK-targeted therapeutics ( 412 ) Zhang J, et al. (2022) Biomark Res, 10: 17. [LINK NOT AVAILABLE] . The approval of pirtobrutinib was based on results from a phase I/II clinical trial, which showed that 50 percent of MCL patients treated with the molecularly targeted therapeutic had tumor shrinkage, with 13 percent having their tumors disappear.
Zanubrutinib, another BTK-targeted therapeutic, was approved for treating patients with MCL in November 2019 ( 413 ) Sengupta R, et al. (2020) Cancer Epidemiol Biomarkers Prev, 29: 1843. [LINK NOT AVAILABLE] . In January 2023, FDA approved zanubrutinib for treating adults who have CLL or SLL, which are slow-growing types of NHL. CLL and SLL are essentially the same disease but have different names depending on where in the body the NHL cells accumulate. CLL cells are found mostly in the blood and bone marrow, whereas SLL cells are found mostly in the lymph nodes.
The approval of zanubrutinib to treat CLL and SLL was based on results from two phase III clinical trials. The first trial which evaluated the efficacy of zanubrutinib in previously untreated patients with CLL/SLL showed that patients who received zanubrutinib lived a longer time without their cancer worsening compared with patients who received standard treatments. In the second trial, which compared zanubrutinib to ibrutinib in CLL/SLL patients whose disease did not respond to or came back after prior treatments, a greater percentage of patients receiving zanubrutinib were alive during the course of the study with no growth of their cancer, compared to patients taking ibrutinib ( 414 ) Brown JR, et al. (2023) N Engl J Med, 388: 319. [LINK NOT AVAILABLE] .
Blocking Progression of Metastatic Prostate Cancers
Prostate cancer is the most commonly diagnosed cancer among men living in the United States. In 2023 alone, more than 288,000 men are expected to be diagnosed with the disease ( 28 ) American Cancer Society. Cancer Facts and Figures. Accessed: July 5, 2023. . Research has shown that up to 30 percent of prostate cancers have mutations in genes that influence the homologous recombination repair (HRR) pathway (e.g., BRCA, ATM), a cellular process in which a group of proteins work together to repair DNA damage ( 415 ) de Bono J, et al. (2020) N Engl J Med, 382: 2091. [LINK NOT AVAILABLE] . Changes in the HRR pathway may result in the inability to repair DNA and lead to accumulation of mutations and cancer.
Poly-ADP ribose polymerase (PARP) proteins are central to a second type of DNA repair pathway called base excision repair. Researchers have found that breast, ovarian, pancreatic, and prostate cancers with genetic mutations that lead to HRR deficiency are responsive to PARP-targeted therapeutics because disruption of these two DNA repair pathways leads to pervasive DNA damage that kills cancer cells. In July 2023, FDA approved a PARP-targeted therapeutic, talazoparib (Talzenna) for treating certain groups of men with metastatic prostate cancer carrying mutations in genes that influence the homologous recombination DNA repair pathway.
Men, such as Colbert English, p. 96, who are diagnosed with metastatic prostate cancer are often treated initially with therapeutics that target androgens, the hormones that fuel prostate cancer growth. When the cancer stops responding to these treatments, it is referred to as castration-resistant prostate cancer. Talazoparib was approved in combination with the androgen-targeted therapeutic enzalutamide (Xtandi) for patients with HRR gene-mutated metastatic castration-resistant prostate cancer. Mutations in HRR genes such as BRCA1, BRCA2, and ATM were assessed prospectively using tumor tissue and/or blood-based DNA sequencing assays. The approval was based on results from a phase III clinical trial that showed that treatment with talazoparib significantly improved progression-free survival compared with treatment with enzalutamide alone ( 416 ) Agarwal N, et al. (2023) Lancet, 402: 291. [LINK NOT AVAILABLE] .
- A Message from AACR
- Executive Summary
- A Snapshot of a Year in Progress
- Cancer in 2023
- Understanding the Path to Cancer Development
- Reducing the Risk of Cancer Development
- Screening for Early Detection
- Spotlight on Immunotherapy: Pushing the Frontier of Cancer Medicine
- Perspective: Looking to the Future of Immunology
- Supporting Cancer Patients and Survivors
- Envisioning the Future of Cancer Science and Medicine
- Advancing the Future of Cancer Research and Care Through Evidence-based Policies
- AACR Call to Action
- AACR President’s Vision: Future of Cancer Research and Care
- AACR Cancer Progress Report 2023: Steering Committee
Your donation to the American Association for Cancer Research helps our more than 58,000 members worldwide drive progress against cancer.

Filter by Keywords
10 Free Progress Report Templates in Excel, Word, & ClickUp
Praburam Srinivasan
Growth Marketing Manager
February 14, 2024
Start using ClickUp today
- Manage all your work in one place
- Collaborate with your team
- Use ClickUp for FREE—forever
Every project manager knows: keeping everyone in the loop on the status of your project can sometimes feel like herding cats. 🤷🏼♀️
Between monitoring the next steps, checking up on your member’s workloads, and reporting back to stakeholders—there’s a lot of information to keep on hand. And it takes more than a detailed folder system on your hard drive to keep it all together.
The solution begins with a standardized progress report system to easily collect and distribute key project management updates in a timely manner.
…But how do you create this standardized process? With a customizable progress report template, of course. 🙂
Progress report templates provide the proper pre-built structure to save time and minimize errors while preparing your progress reports—as long as you know what features to look for!
It all starts with you.
Your specific project requirements, current processes, and your preferred free project management software will impact which progress report template works best for your team and use case. But no need to take to the web! We’ve got everything you need to find the best progress report template in this very article.
Follow along as we cover all of the ins and outs of project progress reports. Find key definitions, feature breakdowns, and access to 10 of the best progress report templates for your favorite work tools.
What is a Progress Report Template?
What makes a good project progress report template, 1. progress report template by clickup, 2. project status report template by clickup, 3. project tracker template by clickup, 4. campaign progress report template by clickup, 5. production tracking template by clickup, 6. hr progress report template by clickup, 7. start stop continue template by clickup, 8. monthly business status report template by clickup, 9. gantt excel progress report template for excel, 10. microsoft word weekly progress report template.
A progress report template is a pre-built form, page, or checklist to consistently provide detailed project documentation in a timely manner. These resources can be tailored to fit the specific needs of your project or team processes, and are generally kept by the project managers to share with members and stakeholders on a weekly or monthly basis.
Progress report templates are easily shared, copied, and customized, eliminating the need to start from scratch every week. Instead, simply plug and play the updates into your custom team document and fire it off to your key players.
But not all progress reports can be shared across teams and industries. Your use case, project type, and tech stack will determine which project progress report template is right for you. And the quicker you can spot the key differences and must-have features, the quicker you’ll be on your way to meeting your goals and delivering the progress reports of your supervisor’s dreams. 💜
So if not all teams can use the same progress report templates, how do you know which template is the one for you?
To avoid the time-consuming and frustrating practice of trial and error, look for the following features when using a template while creating progress reports:
- Customizable and easily edited to tailor the pre-built document to your needs
- Built-in collaboration features like live editing and URL sharing to ensure all members and stakeholders have access
- Multiple views to support a list, Kanban board, Gantt chart, timeline, and other highly visual methods for managing progress
- Actionable tasks to hold members accountable for upcoming items and keep your project moving forward
- Multiple integrations to bring more context into your progress report from other work tools

These five features may be a drop in the bucket compared to what you’re looking for. But the good news is, your template is out there! There are an infinite amount of resources at your fingertips thanks to your favorite search engine, but why waste an hour (or a day) digging through pages of links? Instead, start with the best. 🤓
10 Free Progress Report Templates
We’ve done our homework to bring you the top progress report templates for ClickUp, Excel, and Word. No matter your preferred software, use case, or work style, we’ve got the progress report template you’ve been searching for. ✨

The Progress Report Template by ClickUp is the ideal starting point. Think of this template as the benchmark to compare all other progress report templates to—it’s that versatile! Powered by ClickUp’s dynamic built-in document editor, ClickUp Docs , this template has every key feature you need to establish and optimize your progress reporting processes.
This one-pager is broken down into clear sections to establish the who, what, where, and when of the project you’re dealing with. It’s formatted to help you provide a quick overview of the major updates to keep both the project team and external stakeholders informed about where things stand, and what needs to be done next.
Scrolling down the page, you’ll be prompted to share the status of the project, any milestones it has reached to date, and any next steps needed—everything your stakeholders want to know. It also offers the ability to highlight any issues popping up and need-to-know information for anyone reading the project progress report for the first time.

Ready to kick things up a notch? 🔥
The Project Status Report Template by ClickUp is the digital whiteboard template your visual-learning team members have been asking for! Using ClickUp’s collaborative Whiteboards feature, your team can work together to define:
- The project overview
- Progress made since your last report
- Any additional support or resources needed to move forward
- Key takeaways and report highlights
- Areas that went well and those that need improvement
It’s essentially a highly-visual and collaborative pulse check that you can consult throughout the project to report on its progress—without having to copy a new document each week.
And since this template is designed for ClickUp Whiteboards, you’ll have the power to complete the diagram alongside your team using collaborative live editing, see who’s viewing your board, embed media and website cards from other software, and convert text directly into actionable tasks. Whiteboards truly are every project manager’s dream tool. 🏆

The thing is—you’re probably not managing just one project at a time. Overseeing multiple projects and even more individual tasks can be a daunting feat of its own. Without the right progress report template, communicating the status of each status and its larger project can be nearly impossible! That’s what makes the Project Tracker Template by ClickUp so valuable.
With this List template, you can easily group tasks by their current stages using custom task statuses like Getting Ready , Production , and Going Live —with the ability to add more statuses if needed! But that’s not all. This template is packed with four Custom Fields for:
- Project stage
- Project duration (in days)
- RAG (to communicate priorities)
- Date of completion
Plus, you’ll have access to four ready-made workflow views to manage your project progress from every angle, including a highly visual Gantt chart and interactive Kanban board arranged by tasks per assignee.
Meanwhile, anyone taking a look will be able to look at other tasks related to the, plotting out and executing them in a way that makes sense for everyone involved.

Now let’s dig into the specifics by use case—starting with the Campaign Progress Report Template by ClickUp ! There are a ton of variables to consider when running and managing your advertising campaigns. Unlike software development or employee onboarding, cost and real-time performance metrics play a key role throughout the entire campaign. If one element isn’t sitting well with your audience, it’s time to pivot.
This ClickUp Doc template makes those elements simple to maintain with a formatted document to help you choose which project OKRs to monitor, keep an eye on cost, manage revenue, and more. For example, you can quickly visualize how much of your campaign budget has already been spent to date and how much revenue that investment has brought in. You can also display a chart of clicks and conversions to identify any key trends.
Use this template to monitor your campaign’s ad effectiveness and results, both to share with other stakeholders and to make adjustments as needed for maximum ROI.

Videos are some of the most complex projects most marketing and communications teams take on. They require close collaboration between multiple team members, and sometimes months’ worth of planning, execution, and post-production to publish the final product.
That process gets even more complicated when you’re overseeing the production of multiple videos at a time—that’s when the Production Tracking Template by ClickUp comes in handy.
This hefty template applies five custom task statuses, 11 Custom Fields, and six project views to your Workspace. In the default List view, every video is represented as a task that can be organized by its current status. To manage your production schedule, navigate over to your Calendar view for a visual representation of your posting cadence.
And for overall production progress, use your pre-built Board view to see Custom Fields in action. From your Kanban board, you’ll find key information like client approvals, storyboard links, production types, briefs, and additional resources for more context at a glance. This maintains a streamlined overview, while still providing the details needed to get videos finished on time and on spec for publication.

One of the most important HR processes is assessing new employees after the first 30, 60, and 90 days of their employment. The HR Report Template by ClickUp helps you do just that. Use the simple ClickUp Doc to enter employee information, then note where your new hires may require additional training or supervision.
The single-page template includes sections for multiple review periods, allowing you to track progress over time. The result is a more streamlined process to ensure new employees in your organization succeed in their onboarding.

Every project has important decision points at which you need to determine whether current tasks are worth starting, continuing, or need to be stopped. The Start Stop Continue Template by ClickUp helps you keep track of exactly those decisions.
For each area, you can include virtual sticky notes of tasks that need the action described in that section. Over time, you can move those sticky notes around easily as needed. Finally, helpful color coding ensures that it’s always easy to see what your team needs to focus on or stop doing.
Try these stop start continue templates !

Let’s take it to the 30,000-foot view. If you’re starting a business or shipping a new product, key stakeholders need to know basic information about how that launch is going. The Monthly Business Status Report Template by ClickUp helps to simplify the process.
This ClickUp Doc template offers an easy overview of needed scope changes , deliverables, and capacity issues. It also allows you to highlight the work completed in a given month, giving members and stakeholders a window into how the business is performing and what needs to happen next.

For all you spreadsheet traditionalists out there, this free progress report template for Excel is for you. 💜
A cover sheet allows for basic information, including a traffic-light color code system on overall status, scope, budget, and timeline .
From there, you’ll find a more detailed Gantt chart with the individual tasks that led to larger judgment calls. That way, interested stakeholders and team members can stick with the broader overview, or dig into the details as needed.

The Progress Report Template for Microsoft Word helps project managers deliver the status, project summary , budget overview, and risks related to your project at any given time. This template keeps it simple, with easily edited sections to help you paint the picture of your project’s health over time. Plus, it offers the ability to customize its theming to align with your brand.
How to Provide Feedback on Progress Reports
Now that you have progress report templates, let’s talk about how to give (and receive) feedback on progress reports. Here are some tips to make the process as smooth and productive as possible:
1. Provide Concrete Evidence
When giving feedback on progress reports, it’s essential to provide concrete evidence to support your comments. For example, instead of saying “this report is not detailed enough,” provide specific examples of information that may be missing or could benefit from more detail. This helps the recipient understand exactly what needs to be addressed and how.
2. Focus on Solutions
When providing feedback, it’s important to focus on solutions rather than just pointing out problems. Offer suggestions on how to improve the progress report or address any issues that may have been raised.
3. Be Timely
It’s crucial to provide feedback in a timely manner. Waiting too long to share your thoughts may result in the same issues being repeated in future progress reports, which can slow down project progress.
4. Encourage Open Communication
Encourage open communication between team members when discussing progress reports. This ensures that everyone is on the same page and allows for any questions or concerns to be addressed promptly.
5. Acknowledge Effort
Be sure to acknowledge the effort that went into creating the progress report, even if there are areas that need improvement. This motivates team members and shows them that their work is valued.
6. Be Specific
When receiving feedback on your own progress reports, ask for specific examples or suggestions for improvement. This helps you better understand how to enhance future reports and ensures that everyone is on the same page.
7. Be Open to Change
Be open to change and willing to adjust your progress reports based on feedback. Being open to change will improve the overall effectiveness of the report and ensures that it accurately reflects project progress.
Track Success with a Free Progress Report Template
You know the old saying about focusing on progress over perfection? Well at ClickUp, we believe in progress toward perfection—and the right progress report template is the first step in achieving that!
Investing your time in a progress report template is a simple addition to your production workflow that keeps everyone up-to-date about where the project stands. Any of the templates above will start you off on the right foot, especially a customizable template from ClickUp.
Access all of the templates listed above and over 1,000 more from ClickUp’s vast Template Library , plus, hundreds of rich project management features , tons of integrations, and more when you sign up for ClickUp today !
Questions? Comments? Visit our Help Center for support.
Receive the latest WriteClick Newsletter updates.
Thanks for subscribing to our blog!
Please enter a valid email
- Free training & 24-hour support
- Serious about security & privacy
- 99.99% uptime the last 12 months
Thank you for visiting nature.com. You are using a browser version with limited support for CSS. To obtain the best experience, we recommend you use a more up to date browser (or turn off compatibility mode in Internet Explorer). In the meantime, to ensure continued support, we are displaying the site without styles and JavaScript.
- View all journals
- Explore content
- About the journal
- Publish with us
- Sign up for alerts
- Open access
- Published: 23 March 2023
Quantifying progress in research topics across nations
- Kimitaka Asatani 1 ,
- Sumihiro Oki 2 ,
- Takuya Momma 3 , 4 &
- Ichiro Sakata 1
Scientific Reports volume 13 , Article number: 4759 ( 2023 ) Cite this article
8541 Accesses
2 Citations
103 Altmetric
Metrics details
- Computational science
- Information technology
A scientist’s choice of research topic affects the impact of their work and future career. While the disparity between nations in scientific information, funding, and facilities has decreased, scientists on the cutting edge of their fields are not evenly distributed across nations. Here, we quantify relative progress in research topics of a nation from the time-series comparison of reference lists from papers, using 71 million published papers from Scopus. We discover a steady leading-following relationship in research topics between Western nations or Asian city-states and others. Furthermore, we find that a nation’s share of information-rich scientists in co-authorship networks correlates highly with that nation’s progress in research topics. These results indicate that scientists’ relationships continue to dominate scientific evolution in the age of open access to information and explain the failure or success of nations’ investments in science.
Leading countries in global science increasingly receive more citations than other countries doing similar research

Interdisciplinarity revisited: evidence for research impact and dynamism

The latent structure of global scientific development
Introduction.
Bibliographic databases 1 , open journals 2 , and online educational content 3 have liberated scientists from constraints on access to information. However, certain scientists or groups in hotspots of knowledge 4 tend to produce more significant output 5 , while others follow their lead 6 . Pursuing trends is not the aim of science, and several studies have found that the development of non-conventional research is essential for generating new knowledge 7 , 8 . However, collective attention 9 promotes community discussion and discovery 10 , and research that follows the trend is likely to have greater impact 11 . Recent developments in computational methods are helping scientists and funding agencies discover cutting-edge topics 12 or assess the novelty of paper 13 .
Global investment in science 14 has been narrowing the gap between nations, not only in terms of the number of published articles but also in the number of highly cited articles 15 . China has made significant strides in scientific research in recent decades 14 . The performance of a nation or region is assessed based on the structure of its research system, which is inferred from the output of each research field 16 . A recent study 17 demonstrates that disparities in regional scientific competitiveness are being reduced through the analysis of the concentration of research fields. Conversely, the winners of major scientific awards 18 , top-performing research universities 14 , and high-impact publications 19 remain confined to certain nations, such as the US and the UK. Several domain-specific studies 20 , 21 , 22 have provided insight into the significant role played by certain nations in the development of domains. However, these microscopic analysis requires extensive effort and has not yet been generalized across all fields. Given that certain nations lead in science, several causes of national differences in scientific output have been analyzed: education systems 23 , social diversity 24 , and individual mobility 25 . As funding agencies are dedicated to selecting research topics 26 , it is essential to reveal the structural relationships and inequality between nations in terms of research topic.
In this study, we quantify national research topic progress using time-series comparisons of the references in published papers. The comparison identifies the microscopic difference between the research topics of nations. We assume that the aggregation of reference lists in papers from a nation represents its overall profile of engagement with research topics, as the reference lists are used for unsupervised 27 and supervised 28 estimations of research topics. Using 71 million research papers from Scopus, we identified a leading-following relationship among research topics between pairs of nations. For instance, China and Japan tend to engage in research topics that are similar to those in which the US and the UK previously engaged. Moreover, the accumulation of two-nation comparisons, which we define as the Topic Progress Index (TPI), reveals a long-term leading-following relationship between Western nations and Asian city-states, on the one hand, and other nations.
We also demonstrate that information-rich scientists (those with high eigenvector centrality in co-authorship networks) play a crucial role in steering the progress in research topics. From a co-authorship network of 16 million scientists, we identified information-rich scientists who are engaging in newer research topics that others follow, and who are likely to be cited more frequently. These information-rich scientists are often based in Western nations, and the proportion of information-rich scientists in many nations was correlated with research topics progress. These results provide support for national research strategies that promote global co-authorship 29 , the recruitment of top scientists 30 , and the encouragement of scientists to go abroad and return 31 .
Research topic comparison between pairs of nations
Assuming the reference list of a paper indicates the research topic of the paper, (unregularized) vector representation of the research topics in nation A in year y can be introduced as \(\textbf{T}^{\prime }_{\textbf{A},\textbf{y}}=(T_{1,A,y}^\prime ,T_{2,A,y}^\prime ,\ldots )\) , where each element denotes the aggregation of references \(1,\ 2\ldots\) ’s in nation A in year y. Each paper is assigned to its first author’s nation. We used tfidf weighting 32 for aggregation to adjust the paper’s difference with respect to the number of references and to eliminate the effects of frequently cited references (detailed in “ Methods ” section). Then, we performed L2-normalization of \(\textbf{T}^\prime _{\textbf{A},\textbf{y}}\) to obtain research topic \(\textbf{T}_{A,y}\) .

( a ) Cosine similarity of research topic \(\textbf{T}\) in 2015 between the top 20 paper-publishing nations. The order of the nations is determined by average linkage clustering. ( b ) The cosine similarity matrix of \(\textbf{T}\) between China and the US from 2000 to 2020. ( c – g ) Two-nation comparisons: red lines indicate cosine similarities between \(\textbf{T}\) in 2015 in the US and \(\textbf{T}\) in 2010-2020 in China ( c ), Germany ( d ), the UK ( e ), Japan ( f ), and Switzerland ( g ). Blue lines indicate the opposite comparisons (in the other nation in 2015 and in the US in 2010-2020). ( h ) Yearly change in the TPI of the top 20 paper-publishing nations, plus Hong Kong and Singapore, from 1990 to 2020. ( i ) The average domain-adjusted citation count versus the TPI, both in 2018 for the top 40 paper-publishing nations. The figures were generated using matplotlib(3.6.0) and labeled with Illustrator(26.0.2).
In a comparison of research topic \(\textbf{T}\) in 2015 between the top 40 paper-publishing nations, some groups of nations have a high similarity in research topics (Fig. 1 a). The Anglophone nations (USA, GBR, CAN, DEU, etc.) tend to have a similar research topic, while the Asian nations (CHN, IND, KOR, etc.) have a weaker link. This suggests that the former nations may form the core group in research topics. However, it is unclear which group is leading in research topic. A time-series comparison of \(\textbf{T}\) between nations reveals a time lag in research topic between them (China and the US comparison is shown in Fig. 1 b). The research topic \(\textbf{T}\) in China after 2015 is similar to the \(\textbf{T}\) in the US in 2015 (red line in Fig. 1 c), and \(\textbf{T}\) in the US before 2015 is similar to \(\textbf{T}\) in China in 2015 (blue line in Fig. 1 c). Assuming that research topics neither undergo rapid change nor evolve in a looping process, the difference in slope between the two lines in Fig. 1 c indicates the delayed adoption of research topics in China compared to the US. Japan also lagged behind the United States, whereas Germany was only slightly behind, and the United Kingdom and Switzerland showed no delay (Fig. 1 d-g; other comparisons among the top seven nations are shown in Fig. S1 ). We note that the results that papers are assigned to nations by fractional counting 33 (Fig. S2 ) show similar results that papers are assigned to the first author’s nations (Fig. 1 ).
Quantifying research topic progress of nations
Cosine similarity (cos) is a metric of the similarity between two vectors of an inner product space and is the cosine of the angle between them. In this study, the leading-following relationship between two nations is derived from the time series comparison of the cosine similarity between \(\textbf{T}\) of them (detailed in “ Methods ” section). As with the analysis of the US(A)-China(B) case (Fig. 1 c), the difference between \(cos(\textbf{T}_{{A},{y}},\textbf{T}_{{B},{y}^+})-cos(\textbf{T}_{{A},{y}},\textbf{T}_{{B},{y}^-})\) (change in red line) and \(cos(\textbf{T}_{{B},{y}},\textbf{T}_{{A},{y}^+})-cos(\textbf{T}_{{B},{y}},\textbf{T}_{{A},{y}^-})\) (change in blue line) indicates the US’s progress in research topics. The TPI of a nation is an aggregation of the comparisons with all other nations weighted by their respective numbers of published papers, for time intervals \(\Delta =1,\ 2,\cdots ,\ \tau\) years. We calculated TPI using \(\textbf{T}\) of the top 40 paper-publishing nations during 2010-2020, with parameter \(\tau =5\) years considering both rapidly changing domains such as computer science and others. Because the data were up to 2020, we calculated TPI around 2020 by masking the information after 2020 (detailed in “ Methods ” section).
The Western nations 34 (Western Europe and English-speaking developed nations) and Asian city-states (Singapore and Hong Kong) had high TPI for decades relative to other nations (Fig. 1 h), whereas the dispersion in the number of published papers of those nations settles over time (Fig. S3 ). Taiwan, South Korea, and Japan had low TPI values, but their research topics did not differ markedly from those of the US and UK (Fig. 1 a). Conversely, Switzerland had high TPI values, but its research topics were not similar to those of the US or the UK (Fig. 1 a), indicating that a convergence of research topics with the US was not a necessary condition for research topic progress.
TPI relates to the average domain-adjusted citations, except for some nations (Fig. 1 i). The impact is adjusted by the average number of citations per domain (see the “ Methods ” section). While the average domain-adjusted citations for China and the United States are similar, TPI identifies a leading-following relationship between them. The high citation numbers for papers from Hong Kong and Singapore are ascribed to those nations’ highly selective practices for recruiting scientists. Relative levels of progress or delay in topic uptake among nations are observed in each nation’s evolution of citing high-impact papers (Fig. S4 ): the US and UK tend to cite such papers earlier than China and Japan do. The same trend is observed over the average time (within five years after publication) each nation took to cite the 1000 most-cited papers (Fig. S5 ). However, this naive indicator is biased toward the most-cited articles, and it does not quantify research topic progress until several years later.
Next, we compare the university’s research topic progress to that of Oxford, which is ranked as the top university in the world 35 . Peking University and Tsinghua University lagged behind Oxford University (Fig. 2 a,b). However, the University of Cambridge (Fig. 2 c) did not, and Stanford University(Fig. 2 d) slightly progressed to Oxford University. Other results shown in Fig. S6 indicate that top universities’ progress in research topics aligns with those of their nation. This result indicates that the topic progress of each nation might not correspond with the percentage of high-level universities within it.

Detailed analysis of topic progress in universities: ( a – d ) University-level research topic comparison between Oxford and Peking University ( a ), Tsinghua University ( b ), Cambridge ( c ), or Stanford ( d ). The red lines indicate cosine similarities between \(\textbf{T}\) in 2015 in the Oxford and \(\textbf{T}\) in 2010-2020 in other universities. Blue lines indicate the opposite comparisons.
The research topic progress of the Western world was observed in every domain (Fig. 3 a; domain detail is shown in Supplemental Table T1 ). Note that some perturbed periods at specific domains are excluded (Supplemental Table T2 ). The research topics of Asian nations and Western nations differ in several domains, but they are similar in others (Supplemental Fig. S7 ). For example, Chinese/Indian research topics in the M3-Lifestyle Disease domain differ from those of the US and UK (Fig. 3 d) and lag behind them (Fig. 3 e). In contrast, in the CS1-Computer Science domain, China and India conduct research similar to the US and UK (Fig. 3 b) but lag behind them (Fig. 3 c). The similarity indicates that open access to information and the absence of geographical restrictions in the domain may synchronize the research topic, but the time lag remains.

Detailed analysis topic progress in each domain. ( a Strip )plot of TPI (normalized 0 to 1) of nations in 2020 (in 2019 for M4-Infectious Diseases) in whole domains and in each of the 20 domains. Nations that published less than 300 papers during the year in each domain are excluded. ( b ) Cosine similarity of \(\textbf{T}\) between the top 20 nations in the number of papers in 2020 sorted by average linkage clustering in CS1-Computer Science. ( c ) Detailed plot of domains: the number of papers and TPI for each nation in CS1-Computer Science. ( d , e ) Same plots of ( b , c ) for M3-Lifestyle Disease. The figures were generated using matplotlib(3.6.0) and labeled with Illustrator(26.0.2).
Information-rich scientists and research topic progress
Because of the slight differences in accessible information, the information spread among scientists may determine their research topic. Not surprisingly, the research topics of scientists resemble those of their co-authors (Fig. S8 ). Therefore, co-authorship networks entail a process of dissemination of research topics between scientists. We analyze a co-authorship network consisting of 16 million authors with 395 million relationships. Assuming that the amount of information value a scientist transmits via a link to another scientist is proportional to the amount of information value received, the extent of information value convergence to the node is calculated as the eigenvector centrality 36 . Centrality is used to estimate economic outcomes/social status 37 , 38 and detection of the active part of the brain 39 . For comparison, we also calculated PageRank 40 , which gives more weight to a central node in small subgraphs; degree centrality; and the number of previously published papers.

Information spreading on co-authorship network and research topic progress. ( a ) Blue, orange, green, and red bars show the Spearman correlation coefficients between the domain-adjusted citation count and eigenvector centrality, PageRank, degree centrality, and number of previously published papers for each author, respectively. ( b ) Comparison of \(\textbf{T}\) for the top 50% of papers (on the basis of the highest author eigenvector (EV)) and bottom 50% papers. The comparison is based on the year 2018. ( c ) The relationship between the TPI (2018) and the percentage of authors with the top 10% eigenvector centrality (2018) for each nation. ( d ) Visualization of the co-authorship network: Each scientist is colored in accordance with eigenvector centrality (yellow indicates high, and blue indicates low). The 2D position is obtained by UMAP 41 from the 128-dimensional LINE 28 embedding of the network. The authors of all nations (top left) and of five selected nations are plotted. ( e ) The network of nations based on international co-authorship density. Each edge is weighted by the number of co-authorship links between the pair of nations divided by the lower number of authors among the two nations. Node size indicates the number of authors in each nation. The figures were generated using matplotlib(3.6.0) and labeled with Illustrator(26.0.2).
The eigenvector centrality and degree on the 1999-2018 co-authorship network are correlated with the average domain-adjusted citations (Spearman R \(=\) 0.297 and 0.294, respectively; Fig. 4 a). The higher citation performance of high-degree scientists indicates that a large team or many collaborations increases scientific impact. However, the correlation of PageRank with citation impact is lower. This indicates that the local central position (lab leader, group leader, etc.) within a small sub-network (team or small community) is not critical to citation performance. Eigenvector centrality is not much affected by the scientist’s position in a small sub-network but rather by the information convergence in the whole network. Therefore, the correlation between impact and eigenvector centrality indicates the importance of connectivity to the core scientists of the entire co-authorship network. Moreover, research topics of papers written by high-eigenvector authors progress in research topic compared to those of other papers (Fig. 4 b). However, the difference between centralities is not significant (Fig. S9 ).
After aggregation of scientists on a national scale, the only feature that correlates strongly with a nation’s research topic progress is the proportion of high eigenvector scientists. The proportion of authors with the top n% of eigenvector centrality values is strongly correlated (Spearman R \(=\) 0.879, n = 10%) with the TPI in each nation (Fig. 4 c), and the correlation is also high when n \(=\) 1% or 20% (Fig. S10 ). However, authors with high values of degree centrality or PageRank display weaker correlations (Spearman’s R=0.787 ,n = 0.1% or r=0.568 ,n= 1%, respectively; Fig. S10 ). This result indicates that nations that have scientists located in a global information-spreading core advance in research topic.
The high-eigenvector-centrality scientists are illustrated by bright color in Fig. 4 d. These scientists are located mainly in the middle left area. Scientists in the US, UK, and Switzerland are likely to be located in the same area (middle left of each figure in Fig. 4 d), and the area is populated with a high percentage of high-eigenvector-centrality (yellow) scientists. By contrast, most Chinese and Japanese scientists plot separately in the peripheral areas. National differences in the proportion of high-eigenvector-centrality scientists are explained by the international co-authorship density (Fig. 4 e). Western nation’s scientists frequently coauthor with scientists in other western nations. Other peripheral nations such as China and Japan have low collaboration with western nations, and collaboration in these peripheral nations is also rare. Therefore, scientific information is spread intensively among scientists in Western nations, and scientists in other nations are exposed to little valuable information.
The historical and global divide in research topic progress remains strong, despite the advancement of developing nations in science 42 and the increased open access to scientific information 1 , 2 , 3 . Research topics originating in the Western World and city-state nations in Asia are later engaged with by the rest of the world, such as Japan, Brazil, and South Africa, consistent with many domain-specific analyses 20 , 21 , 22 . Interestingly, time-lags are observed in all the analyzed domains, including computer science, in which there are fewer geographical constraints on access to information and computing hardware.
The TPI correlates strongly with the percentage of information-rich scientists. This analysis explains why open nations (characterized by high co-authorship and mobility of scientists) have greater impact on science 2 . The UK and the US have highly ranked universities 43 that educate top scientists who frequently conduct joint research with scientists at institutions in other nations 44 . These highly ranked UK and US universities attract notable international scientists 25 . To reduce the gap with the west, China encourages its scientists to conduct research abroad and then return to China 45 . At the end of the 1990s, Hong Kong and Singapore had successfully advanced research topics (Fig. 1 h), demonstrating their cultivation of a productive research ecosystem 46 . Conversely, China and Japan were falling behind in research topics and had few information-rich scientists. This difference is consistent with the observation that a large, long-term investment in science does not necessarily result in a leading position in pioneering new research topics and trends. However, given the rapid expansion of the number of Chinese scientists and China’s government strategy 47 , future structural changes in co-authorship networks must be expected.
Analyses of culture, art, and business indicate that individual creativity is increased in networks or places where creative people congregate. For instance, a person obtains a higher income if at the center of a local community 48 , or that person becomes commercially more successful if he or she is close to the center of an art market 49 . Other analyses have demonstrated that the number of registered patents 50 and talented parsons 51 highlight the scale effects of collective creativity among regions or nations. A further study 52 demonstrated a link between national performance and the centrality of its components (national products) in the estimated components-relationship network. Our study demonstrates the scale effect on creative outputs from a large-scale network of individual records of research activities.
A limitation of this study is that TPI cannot evaluate the topic progress of a group of scientists who have small numbers of publications. Because TPI assumes continuous changes in research topics, it is not valid for domains where the research topic is dynamically changing (such as in the study of infectious diseases in 2020). TPI is a quantification of the time-delay in science between some sets of papers, but it does not assure a causal relationship in the time-delay between them. To explain the emergence of delays in research topics across nations, a statistical model that generates a time-series of topic changes of nations needs to be developed.
TPI is not a direct indicator of each nation’s research creativity. Advanced research topics do not always generate creative outcomes, but the two factors are closely related in modern society. We need to analyze other factors that contribute research topic progress of nations. For example, TPI does not correlate with basic skills in reading, math, and science 53 , which indicates that students in nations whose research topics are delayed may lose their chance to conduct important research. Additionally, the high TPI in the Western World (Fig. 1 h) might be facilitated by the ready availability of English-language skills in those nations. Paper’s language can influence citations 54 , and language skills may affect a scientist’s connection to central scientists who may speak English. These language barriers could be reflected in the structural divide of nations in the co-authorship network (Fig. 4 d). It is also necessary to examine whether nationality bias plays a role in peer review, as has been demonstrated for gender bias 55 .
To compare and quantify the research topics progress, we extracted the reference lists from all published papers indexed in Scopus. We estimate the topic of a paper from the tfidf value of the contained reference list. The aggregation of tfidf papers of year y at nation A is considered research topic \(\textbf{T}_{A,y}\) . Then, we conducted a time-series comparison of \(\textbf{T}\) between nations and analyzed the progress/delay in research topics. Next, we simulated the information-spreading on a co-authorship network; in this part, with simple assumptions on information-spreading, we calculated the network centrality of the author.

Calculation of Leading-Following Relationships Between Nations: ( a ) The research topic \(\textbf{T}\) is based on references in the papers published in a particular year. We weight each reference by using the \(\textrm{tfidf}\) framework. For each paper, \(\mathrm {tf(r,p)}\) (the reference frequency of r in paper p) is the number of occurrences of r divided by the total number of references in the paper. We sum the values of \(\textrm{tf}\) for \(P_{A,y}\) (papers published in nation A during year y), weighted by the inverse document frequency \(\textrm{idf}\) (as discussed in the “ Methods ” section). \(\textrm{idf}\) indicates the rarity of the references (the amount of information the reference provides) 32 . ( b ) Topic progress/delay between pairs of nations: \(D_{A,B}^{y^-,y,y^+}\) is calculated as the difference between the amount of rise of the red and blue lines. The red line indicates the extent to which nation B follows nation A (the blue line indicates the converse). In the example shown, research topics in nation A are followed by those in nation B.
Data preprocessing
The Scopus dataset covers all domains of science. We use 70,731,510 papers from 1970 to 2020 categorized as articles, letters, reviews, and conference papers, excluding other forms of published documents, such as errata, conference reviews, and books. A few articles with no information on authors or affiliations were excluded. Note that authorship and affiliation are identified with high accuracy in Scopus 56 .
Internationally co-authored papers totaled 12,922,609. We adopted first author’s first affiliation protocol to select the nation where the main part of paper was conducted, as in most cases the contribution of the first author to a paper is significant. In the co-authorship analysis, we specified an author’s nation as the nation that appeared most frequently in the affiliations listed in the author’s publications in the preceding five years. If this protocol generated multiple nations for an author, the nation for the author was randomly assigned from among the multiple nations.
We also perform fractional counting of papers 33 for each nation to obtain robust results. (Fig. S2 shows the results using fractional counting). When using fractional counting, international co-authorship papers between two nations result in a high similarity in research topics comparison.
Clustering and extraction of fields
The Scopus data include field labels, keywords, and journal categories of papers. The label of a published journal was used to estimate the field labels of papers published in that journal. However, multiple field labels and keywords were assigned to some papers. Furthermore, the recent development of interdisciplinary mega-journals made it difficult to categorize certain journals as belonging to one field.
Consequently, we adopted citation network clustering, because the reference list of the paper contains information about its domain. We used the Leiden method 57 to cluster the papers on the citation networks consisting of 1,217,886,002 edges. We obtained 20 clusters (called domains) composed of more than 500,000 papers each, in the form of applied physics, infectious diseases, computer science, etc. We performed recursive clustering using the same method and obtained sub-clusters (sub-domains) for use in calculating the domain-adjusted citation count and in extracting key phrases. The details of the clusters and sub-clusters are presented in Supplemental Table T1 .
Calculating domain-adjusted citation count
The number of citations differs considerably across domains or sub-domains. For example, papers in the chemical and medical sciences tend to carry more citations than papers in the social sciences and humanities. To remove this inequality, the citation count of a paper was normalized by dividing it by the average citation count of the corresponding sub-domain. The mean of the domain-normalized citation count was then set equal to the mean of the original citation count for improving interpretability. Domain normalization is widely used as field-weighted citation impact 58 and field-weighted citation impact 59 .
tfidf Vector of References
References in a paper are associated with the research topic of that paper. Therefore, the aggregation of reference lists from papers published by a nation in a specific year represents the research topics in which the nation is engaged during that period. The multiset of references in a paper, operationalized as a bag of words (BOW) in natural language processing, is a straightforward representation of the research topic of the paper. However, there are a substantial number of highly cited references, and these highly cited references heavily influence the BOW of references. To avoid heavy influence of such references, we applied the \(\textrm{tfidf}\) weighting framework to evaluate the amount of information that each reference(term) carried in a paper 32 .
Figure 5 a shows the procedure to calculate research topic \(\textbf{T}\) . In Eq. ( 1 ), the value of \(\textrm{tfidf}(r,p)\) is the product of the reference(term) frequency \(\textrm{tf}(r,p)\) , and the inverse paper(document) frequency.
In Eq. ( 2 ), \(e_{r,p}\) denotes the existence of reference r in paper p (if the reference is present, \(e_{r,p}=1\) , otherwise \(e_{r,p}=0\) ). The quantity \(\textrm{idf}(r,P_{all})\) indicates the rarity of the reference r in the entire set of papers \(P_{all}\) . In Eq. ( 3 ), \(\textrm{idf}(r,P_{all})\) is the logarithmically scaled index of the maximum number of references appearing, \(\max _{r^{\prime } \in P_{all}} n_{r^{\prime }}\) divided by \(1+n_r\) , where \(n_r\) is the number of times that the reference r appears in \(P_{all}\) .
In Eq. ( 4 ), \(t_{r,A,y}^\prime\) (the prevalence of research including reference r for nation A in year y) is the sum of the \(\textrm{tfidf}\) values for reference r over \(P_{A,y}\) (all papers from nation A in year y). The list of research topics accommodating all references for nation A in year y is denoted as \(\textbf{T}^\prime _{A,y}=(t_{1,A,y}^\prime ,t_{2,A,y}^\prime ,\ldots )\) . \(\textbf{T}^\prime _{A,y}\) was normalized so that its L2 norm was 1, and we obtained research topic \(\textbf{T}_{A,y}=(t_{1,A,y},t_{2,A,y},\ldots )\) of nation A at year y.
Papers containing more than 100 or fewer than 5 references were omitted from the analysis to exclude review papers and incomplete data. We ignored references with citation numbers more than 1000 to prevent distortions of cosine similarity; these commonly cited references could not add meaningful information to the analysis because they were likely to be cited from a wide range of papers. This procedure is standard in calculating the \(\textrm{tfidf}\) in natural language processing to enhance task performance 60 .
Calculation of TPI
First, we considered the topic of influence between a pair of nations on a reference r at year y considering a rise from \(y^-\) to \(y^+\) . Nation A’s degree of being followed by nation B on reference r is quantified as the product of \(t_{r,B,y^+}-t_{r,B,y^-}\) (B’s increase of engagement on the topic from \(y^-\) to \(y^+\) ) and \(t_{r,A,y}\) (A’s engagement with the topic at t). Consequently, the extent of A’s topic progress toward B with respect to reference r can be calculated from the difference between A’s degree of being followed by B and B’s degree of being followed by A [Eq. ( 5 )]. When A or B does not engage with the research topics related to reference r , \(d_{A,B}^{y^-,y,y^+}\) equals 0.
A’s degree of being followed by B in year y considering the change of research topic from \(y^-\) to \(y^+\) , \(D_{A,B}^{y^-,y,y^+}\) was calculated from the sum of the \(d_{A,B}^{y^-,y,y^+}(r)\) for the entire set of references \(R_{all}\) . We divided the values by their similarities for the entire set of references at y [denominator in Eq. ( 6 )]. This is because the closer the distance between \(\textbf{T}\) in the pair of nations, the closer the mutual relationship, and the easier it was to propagate the topic. Considering that the L2 norm of \(\textbf{T}\) equals 1, \(D_{A,B}^{y^-,y,y^+}\) was calculated as the basic arithmetic operation of the cosine similarity of \(\textbf{T}\) [Eq. ( 7 )]. Intuitively, the quantity \(D_{A,B}^{y^-,y,y^+}\) is the difference between the amounts of rise of the red and blue lines in Fig. 5 b divided by the cosine similarity of \(\textbf{T}\) between the pair of nations at y.
Equation ( 8 ) describes the non-normalized TPI of nation A at y, \(TPI_{A,y}^\prime\) . We calculated averaged \(D_{A,X,y}^{y^-,y,y^+}\) for all other nations weighted by the share of the number of published papers of nation X at year y, \(S_X^y\) . Then we summed the value for all \((y^-,y^+)=(y-1,y+1),\ldots ,(y-\tau ,y+\tau )\) . We used \(\tau = 5\) years to consider both short-term topic transitions, such as in computer science, and long-term transitions, such as in the humanities. When the similarity in research topics between A and B was low, \(cos(\textbf{T}_{A,y},\textbf{T}_{B,y})<0.005\) , and we considered \(D_{A,B}^{y^-,y,y^+}=0\) to avoid large responses to small changes in the research topics of A or B. Finally, \({TPI}^\prime\) for each nation in a particular year was standardized such that the average was 0 and the standard deviation was 1. Consequently, we obtained the TPI [Eq. ( 9 )]:
Data limitations affected the calculation of TPI after \(2020 - \tau\) . When we calculated the TPI in 2019 with \(\tau = 2\) years, the data for 2021 were missing. We assumed that the cosine similarity between \(\textbf{T}_{y} \{y \mid y<=2020\}\) and \(\textbf{T}_{y'} \{y' \mid y'>2020\}\) for any combination of nations were the same constant value. Consequently, when \(y^+>2020\) , \(cos(\textbf{T}_{A,y},\textbf{T}_{B,y^+}\) ) and \(cos(\textbf{T}_{B,y},\textbf{T}_{A,y^+})\) in Eq. ( 7 ) cancel each other. Thus, TPI after \(2020-\tau\) is calculated from data up to 2020.
Centrality analysis in the co-authorship network
We constructed a co-authorship network for 2018 from the preceding 20 years of co-author relationships. When N authors authored a paper, the weight of each edge was \(1/(\hbox {N}-1)\) , assuming that one author interacted equally with the remaining N-1 authors. Papers with more than 30 authors were ignored to avoid the impact of hyperauthorship. Furthermore, only the largest connected component was extracted for analysis. Eigenvector centrality (weighted), PageRank (weighted, \(\alpha = 0.85\) ) and degree centrality (un-weighted) were calculated for each node using the igraph library 61 .
Data availability
The data that support the findings of this study are available from Elsevier but restrictions apply to the availability of these data, which were used under license for the current study, and so are not publicly available. Data are however available from the author (Kimitaka Asatani) upon reasonable request and with permission of Elsevier.
Martín-Martín, A., Orduna-Malea, E., Thelwall, M. & López-Cózar, E. D. Google scholar, web of science, and scopus: A systematic comparison of citations in 252 subject categories. J. Inform. 12 , 1160–1177 (2018).
Article Google Scholar
Wang, X., Liu, C., Mao, W. & Fang, Z. The open access advantage considering citation, article usage and social media attention. Scientometrics 103 , 555–564 (2015).
Bowen, W. G. Higher Education in the Digital Age (Princeton University Press, Princeton, 2015).
Book Google Scholar
Mukherjee, S., Romero, D. M., Jones, B. & Uzzi, B. The nearly universal link between the age of past knowledge and tomorrow’s breakthroughs in science and technology: The hotspot. Sci. Adv. 3 , e1601315 (2017).
Article ADS PubMed PubMed Central Google Scholar
Sekara, V. et al. The chaperone effect in scientific publishing. Proc. Natl. Acad. Sci. 115 , 12603–12607 (2018).
Article ADS CAS PubMed PubMed Central Google Scholar
Zhao, F., Zhang, Y., Lu, J. & Shai, O. Measuring academic influence using heterogeneous author-citation networks. Scientometrics 118 , 1119–1140 (2019).
Van Raan, A. F. Sleeping beauties in science. Scientometrics 59 , 467–472 (2004).
Zhao, W., Korobskiy, D. & Chacko, G. Delayed recognition: A co-citation perspective. Front. Res. Metr. Anal. 5 , 21 (2021).
Foster, J. G., Rzhetsky, A. & Evans, J. A. Tradition and innovation in scientists’ research strategies. Am. Sociol. Rev. 80 , 875–908 (2015).
Rzhetsky, A., Foster, J. G., Foster, I. T. & Evans, J. A. Choosing experiments to accelerate collective discovery. Proc. Natl. Acad. Sci. 112 , 14569–14574 (2015).
Asatani, K., Mori, J., Ochi, M. & Sakata, I. Detecting trends in academic research from a citation network using network representation learning. PLoS ONE 13 , e0197260 (2018).
Article PubMed PubMed Central Google Scholar
Blei, D. M. & Lafferty, J. D. Dynamic topic models. In Proceedings of the 23rd International Conference on Machine Learning , 113–120 (2006).
Hatakeyama-Sato, K. & Oyaizu, K. Integrating multiple materials science projects in a single neural network. Commun. Mater. 1 , 1–10 (2020).
China overtakes the EU in high-impact publications (2021).
Kai, N., Asako, M., Kuniko, O. & Masatsura, I. Digest of Japanese Science and Technology Indicators 2021 (Japanese National Institute of Science and Technology Policy (NISTEP), 2021).
Cimini, G., Gabrielli, A. & Sylos Labini, F. The scientific competitiveness of nations. PLoS ONE 9 , e113470 (2014).
Patelli, A., Napolitano, L., Cimini, G. & Gabrielli, A. Geography of science: Competitiveness and inequality. J. Inform. 17 , 101357 (2023).
Gros, C. An empirical study of the per capita yield of science nobel prizes: Is the us era coming to an end?. R. Soc. Open Sci. 5 , 180167 (2018).
Bornmann, L., Wagner, C. & Leydesdorff, L. Brics countries and scientific excellence: A bibliometric analysis of most frequently cited papers. J. Assoc. Inf. Sci. Technol. 66 , 1507–1513 (2015).
Article CAS Google Scholar
Daston, L. & Most, G. W. History of science and history of philologies. Isis 106 , 378–390 (2015).
Article PubMed Google Scholar
Wei, T. et al. Do scientists trace hot topics?. Sci. Rep. 3 , 1–5 (2013).
Wang, Z. American hegemony and the postwar reconstruction of science in Europe (2007).
Luck, M. Creating effective undergraduate research programmes in science: The transformation from student to scientist (2009).
Nielsen, M. W., Bloch, C. W. & Schiebinger, L. Making gender diversity work for scientific discovery and innovation. Nat. Hum. Behav. 2 , 726–734 (2018).
Verginer, L. & Riccaboni, M. Brain-circulation network: The global mobility of the life scientists. In IMT LUCCA EIC WORKING PAPER (2018).
Chalmers, I. et al. How to increase value and reduce waste when research priorities are set. Lancet 383 , 156–165 (2014).
Šubelj, L., van Eck, N. J. & Waltman, L. Clustering scientific publications based on citation relations: A systematic comparison of different methods. PLoS ONE 11 , e0154404 (2016).
Tang, J. et al. Line: Large-scale information network embedding. In Proceedings of the 24th International Conference on World Wide Web , 1067–1077 (2015).
Wagner, C. S. & Jonkers, K. Open countries have strong science. Nature 550 , 32–33 (2017).
Article ADS CAS PubMed Google Scholar
Boey, F. Strategies for academic and research excellence for a young university: Perspectives from singapore. Ethics Sci. Environ. Polit. https://doi.org/10.3354/esep00139 (2013).
Cao, C., Baas, J., Wagner, C. S. & Jonkers, K. Returning scientists and the emergence of china’s science system. Sci. Public Policy 47 , 172–183 (2020).
Aizawa, A. An information-theoretic perspective of tf-idf measures. Inf. Process. Manag. 39 , 45–65 (2003).
Article MATH Google Scholar
Moed, H. F. Citation Analysis in Research Evaluation Vol. 9 (Springer, New York, 2006).
Google Scholar
Huntington, S. P. The clash of civilizations? In Culture and Dolitics , 99–118 (Springer, 2000).
World university rankings 2020, times higher education (the). https://www.timeshighereducation.com/world-university-rankings/2020/world-ranking . Accessed 21 Oct 2021.
Bonacich, P. Some unique properties of eigenvector centrality. Soc. Netw. 29 , 555–564 (2007).
Cruz, C., Labonne, J. & Querubin, P. Politician family networks and electoral outcomes: Evidence from the philippines. Am. Econ. Rev. 107 , 3006–37 (2017).
Jackson, M. O. Social and Economic Networks (Princeton University Press, Princeton, 2010).
Book MATH Google Scholar
Lohmann, G. et al. Eigenvector centrality mapping for analyzing connectivity patterns in FMRI data of the human brain. PLoS ONE 5 , e10232 (2010).
Page, L., Brin, S., Motwani, R. & Winograd, T. The pagerank citation ranking: Bringing order to the web. Tech. Rep., Stanford InfoLab (1999).
McInnes, L., Healy, J. & Melville, J. Umap: Uniform manifold approximation and projection for dimension reduction. arXiv preprint arXiv:1802.03426 (2018).
UNESCO Institute for Statistics, Q., Montreal. Global investments in r &d. fact sheet no. 59, june 2020, fs/2020/sci/59. http://uis.unesco.org/sites/default/files/documents/fs59-global-investments-rd-2020-en.pdf . (Accessed on 09/21/2021).
Jöns, H. & Hoyler, M. Global geographies of higher education: The perspective of world university rankings. Geoforum 46 , 45–59 (2013).
Abbott, A. & Schiermeier, Q. How European scientists will spend [euro] 100 billion. Nature 569 , 472–476 (2019).
Marini, G. & Yang, L. Globally bred Chinese talents returning home: An analysis of a reverse brain-drain flagship policy. Sci. Public Policy 48 , 541–552 (2021).
Singapore: 50 years of science and technology (2018).
Serger, S. S., Cao, C., Wagner, C., Beldarrain, X. G. & Jonkers, K. What do china’s scientific ambitions mean for science-and the world? Issues Sci. Technol. (2021).
Luo, S., Morone, F., Sarraute, C., Travizano, M. & Makse, H. A. Inferring personal economic status from social network location. Nat. Commun. 8 , 1–7 (2017).
Fraiberger, S. P., Sinatra, R., Resch, M., Riedl, C. & Barabási, A.-L. Quantifying reputation and success in art. Science 362 , 825–829 (2018).
Bettencourt, L. M., Lobo, J., Helbing, D., Kühnert, C. & West, G. B. Growth, innovation, scaling, and the pace of life in cities. Proc. Natl. Acad. Sci. 104 , 7301–7306 (2007).
Schich, M. et al. A network framework of cultural history. Science 345 , 558–562 (2014).
Hidalgo, C. A., Klinger, B., Barabási, A.-L. & Hausmann, R. The product space conditions the development of nations. Science 317 , 482–487 (2007).
Schleicher, A. Insights and interpretations.. Pisa 2018 , 10 (2018).
Di Bitetti, M. S. & Ferreras, J. A. Publish (in English) or perish: The effect on citation rate of using languages other than English in scientific publications. Ambio 46 , 121–127 (2017).
Squazzoni, F. et al. Peer review and gender bias: A study on 145 scholarly journals. Sci. Adv. 7 , eabd0299 (2021).
Baas, J., Schotten, M., Plume, A., Côté, G. & Karimi, R. Scopus as a curated, high-quality bibliometric data source for academic research in quantitative science studies. Quant. Sci. Stud. 1 , 377–386 (2020).
Traag, V. A., Waltman, L. & Van Eck, N. J. From Louvain to Leiden: Guaranteeing well-connected communities. Sci. Rep. 9 , 1–12 (2019).
Jappe, A. Professional standards in bibliometric research evaluation? A meta-evaluation of European assessment practice 2005–2019. PLoS ONE 15 , e0231735 (2020).
Article CAS PubMed PubMed Central Google Scholar
Khor, K. A. & Yu, L.-G. Influence of international co-authorship on the research citation impact of young universities. Scientometrics 107 , 1095–1110 (2016).
Rajaraman, A. & Ullman, J. D. Mining of Massive Datasets (Cambridge University Press, Cambridge, 2011).
Csardi, G. et al. The igraph software package for complex network research. I. J. Complex Syst. 1695 , 1–9 (2006).
Download references
Author information
Authors and affiliations.
Department of Engineering, University of Tokyo, Tokyo, Japan
Kimitaka Asatani & Ichiro Sakata
Amsterdam School of Historical Studies, Universiteit van Amsterdam, Amsterdam, The Netherlands
Sumihiro Oki
School of Humanities, Kwansei Gakuin University, Nishinomiya, Japan
Takuya Momma
Japan Society for the Promotion of Science, Tokyo, Japan
You can also search for this author in PubMed Google Scholar
Contributions
Conceptualization: K.A., O.S., T.M. Methodology: K.A., I.S. Investigation: K.A., O.S., T.M. Visualization: K.A. Funding acquisition: K.A., I.S. Project administration: I.S. Writing—original draft: K.A. Writing—review editing: O.S., T.M., I.S.
Corresponding author
Correspondence to Kimitaka Asatani .
Ethics declarations
Competing interests.
The authors declare no competing interests.
Additional information
Publisher's note.
Springer Nature remains neutral with regard to jurisdictional claims in published maps and institutional affiliations.
Supplementary Information
Supplementary information., rights and permissions.
Open Access This article is licensed under a Creative Commons Attribution 4.0 International License, which permits use, sharing, adaptation, distribution and reproduction in any medium or format, as long as you give appropriate credit to the original author(s) and the source, provide a link to the Creative Commons licence, and indicate if changes were made. The images or other third party material in this article are included in the article's Creative Commons licence, unless indicated otherwise in a credit line to the material. If material is not included in the article's Creative Commons licence and your intended use is not permitted by statutory regulation or exceeds the permitted use, you will need to obtain permission directly from the copyright holder. To view a copy of this licence, visit http://creativecommons.org/licenses/by/4.0/ .
Reprints and permissions
About this article
Cite this article.
Asatani, K., Oki, S., Momma, T. et al. Quantifying progress in research topics across nations. Sci Rep 13 , 4759 (2023). https://doi.org/10.1038/s41598-023-31452-8
Download citation
Received : 21 September 2022
Accepted : 12 March 2023
Published : 23 March 2023
DOI : https://doi.org/10.1038/s41598-023-31452-8
Share this article
Anyone you share the following link with will be able to read this content:
Sorry, a shareable link is not currently available for this article.
Provided by the Springer Nature SharedIt content-sharing initiative
By submitting a comment you agree to abide by our Terms and Community Guidelines . If you find something abusive or that does not comply with our terms or guidelines please flag it as inappropriate.
Quick links
- Explore articles by subject
- Guide to authors
- Editorial policies
Sign up for the Nature Briefing: AI and Robotics newsletter — what matters in AI and robotics research, free to your inbox weekly.

- For law professionals
- For the public
- Becoming a solicitor
- Research and publications
SQE Equality, Diversity and Inclusion Risk Assessment update on progress (March 2021 to February 2024)
10 April 2024
Introduction
Introduced in September 2021, the Solicitors Qualifying Examination (SQE) is a single, rigorous assessment for all aspiring solicitors. We introduced the SQE to ensure consistent and high standards at the point of admission and to encourage new and diverse pathways to qualifying as a solicitor.
The assessment consists of two parts: SQE1 tests candidates' functioning legal knowledge, while SQE2 tests their practical legal skills. To date, more than 14,500 candidates have taken SQE1, and more than 4,500 candidates have taken SQE2. The tests have been conducted in more than 60 countries.
This is an update on the progress we've made towards fulfilling our commitments in the SQE Equality, Diversity and Inclusion Risk Assessment , published in July 2020. It outlines the actions we've taken to address the risks identified in the assessment between March 2021 and February 2024. We also previously reported on the actions we took between July 2020 and February 2021 .
For the first time, this report provides updates on the equality, diversity and inclusion (EDI) commitments that were only possible to progress once the SQE went live in September 2021. These include:
- analysing individual questions for patterns of differential performance
- informing candidates of their full SQE results
- gathering evidence on the experiences of candidates and organisations with qualifying work experience (QWE).
The report gives updates on each of the four key areas covered in the 2020 risk assessment:
- quality of training during QWE.
We have also provided an update on our SQE engagement activities with key stakeholders and representative groups.
A key objective of the SQE is to assure consistent, high standards for all qualifying solicitors. Under the old system, the assessment providers (who also provided the training) they had different assessment methods and pass rates, which created uncertainty about whether all newly qualified solicitors had acquired the same levels of knowledge and skills.
With the introduction of the SQE, all aspiring solicitors are now assessed to the same rigorous standards. This makes the process fairer because all candidates are now assessed against the same standard regardless of their training or prior achievement.
We are dedicated to making sure the SQE is a fair assessment for all candidates. In our 2020 EDI Risk Assessment, we committed to the following actions in this area:
- monitoring performance by protected characteristics on an ongoing basis
- analysing individual questions on an ongoing basis to check for patterns of differential performance
- recruiting a diverse assessor team
- ensuring diversity training is mandatory for assessors, markers and question writers
- conducting a full evaluation of the SQE
- engaging with representative groups working in this area
- researching the underlying causes of disparities in performance
- reporting on the profile of SQE candidates and newly qualified solicitors.
We provide updates on each of these commitments below. We also report on our progress in making the SQE is available in the Welsh language and that candidates with disabilities have access to assistive technology and reasonable adjustments.
Monitoring performance by protected characteristics
We collect data from all SQE candidates via an online monitoring and maximising diversity survey. Candidates complete this survey before registering for the SQE assessments.
A benefit of the SQE is that it allows us to gather consistent cohort-wide data on the performance of candidates broken down by protected characteristics and socio-economic background. The data collected from a centralised assessment gives us dependable and comparable evidence on differential performance by group. Under the old qualification route, it was not possible to collect accurate cohort-wide data on the performance of candidates, as each assessment provider used their own assessment methods.
The post assessment reports and the SQE annual assessment reports include data on performance by the protected characteristics of ethnicity, disability, sex, religion or belief, and age. So far, we have found that:
- Candidates who reported being in White or Mixed/multiple ethnic groups achieved higher pass rates than those from an Asian/Asian British or Black/Black British background (this is similar to previous findings in respect to the Legal Practice Course). We have commissioned independent research to help us better understand the factors that contribute to this disparity .
- There were similar pass rates for candidates who declared a disability and those who did not.
- Candidates in the 25-34 age group (who make up the majority of candidates) achieved higher pass rates than candidates in older age brackets.
- Candidates who reported their sex as male achieved a higher pass rate than female candidates in SQE1. The opposite was the case in SQE2.
- Candidates who reported that their sexual orientation was bi, gay/lesbian or other achieved higher pass rates than heterosexual/straight candidates in SQE1 assessments, but there were no significant differences in SQE2.
Analysing individual questions and stations
After each assessment, all questions and stations are investigated to check for any patterns of differential performance alongside other indicators of performance as part of a routine post assessment validation process. Any elements of an SQE assessment that are flagged by the statistical analysis are given particular attention and are discussed by the SQE Assessment Board.
Recruiting a diverse assessor team
Kaplan, our SQE assessment provider, has set targets and developed an action plan to increase diversity among SQE question writers, markers and assessors. Their latest data shows that diversity by ethnic group is increasing for the pool of SQE examiners overall.
In 2022/23, the diversity by ethnic group increased for SQE1 question writers, SQE2 question writers and SQE solicitor markers. For SQE2 solicitor assessors, the profile remained aligned to the profile of diversity by ethnic group for solicitors in England and Wales.
Diversity training for assessors, markers and question writers
All new solicitor assessors and markers are required to complete Kaplan's equality, diversity and inclusion training before assessing for the first time. The training must be renewed by all assessors and markers on an annual basis.
Kaplan also requires any SQE1 question writers to complete new writer training which includes training on equality and diversity and avoiding gender, ideological, racial, religious, ethnic or other bias in questions. The training also covers stereotyping.
Kaplan's academic subject heads work to avoid bias in questions and so will check for it in the early stages of the question writing process. There are various stages of quality assurance checks where this can also be identified, including at the formal academic review stage and review by Subject Matter Experts appointed by the SRA.
The SQE evaluation programme
We have published a five-phase programme to evaluate the SQE. In phase one, completed in 2021, an evaluation framework was developed by an external independent consultancy, Pye Tait.
Phase two, completed in March 2023, consisted of an initial perception study of both the SQE and QWE. These studies will serve as a baseline for future surveys, allowing us to monitor what is and is not perceived to be working well over time.
Phase three of the programme will consist of an initial evaluation of the SQE, which we will commission later this year. It will include an assessment of the market impacts of our reforms, including any equality impacts.
Phase four of the programme will begin in 2026. During this phase, we plan to produce another perception survey and a further study on the impacts of QWE. We will also commission an independent evaluation of the SQE.
The final phase of our evaluation programme will occur ten years after the SQE's introduction. The findings of earlier phases will shape our plans for this phase, but it will include another full independent evaluation of the reforms.
Our engagement with representative groups working in this area
We have continued to engage with The Law Society and its representative groups, including the Disabled Solicitors Network, Junior Solicitors Network and Ethnic Solicitors Network. Discussions focused on a range of issues related to the SQE exam, such as reasonable adjustments for candidates, assistive technologies and mitigating circumstances.
We have an ongoing dialogue with independent networks that represent solicitors and aspiring solicitors. We have provided bespoke webinars on the SQE to the members of several groups, including the:
- Black Solicitors Network
- Sole Practitioners Group
- British Nigerian Lawyers Forum
- British-Ghanaian Lawyers Union
- Association of British Tamil Lawyers.
These webinars have been designed to provide detailed guidance and answer questions on a range of issues, including:
- qualifications and experience that could equate to a degree
- how to find qualifying work experience
- how to record and confirm QWE
- solicitor apprenticeships
- sources of funding for SQE preparatory training.
Researching the underlying causes of differential outcomes in professional assessments
In December 2021, we commissioned research from the University of Exeter to examine what factors could be influencing the differential outcomes we, and others, have seen in professional assessments. The first phase of this work was completed in June 2023. It was a detailed review of the literature on differential outcomes by ethnicity in professional assessments.
The review analysed more than 250 academic, government and professional reports and articles from both the UK and international sources. The researchers also consulted with 25 experts, including other academics, regulators and members of the profession. The review has shown that the reasons for differential outcomes in professional assessments are wide and varied, with the key factors beyond the direct control of the candidates themselves.
The second and final phase of the research will provide an in-depth analysis of the influence of these factors on the differential outcomes in legal professional assessments. The research will use interviews and surveys to examine the lived experiences of aspiring solicitors and past candidates. The final report will be published in spring 2024.
The research has focused on the assessments in place before the SQE was introduced where there was sufficient historical data to undertake meaningful analysis. We anticipate that the findings will be relevant to the SQE, and we will take those findings into account when we do the evaluation programme referenced earlier.
Reporting on the profile of SQE candidates and newly qualified solicitors
The post assessment reports and the SQE annual assessment reports provide data on the performance of candidates based on:
- their protected characteristics
- the type of school they attended
- whether their parents had a university education
- the occupation of their main household earner when they were around 14
- their highest level of education, and their degree classification.
We also produce an annual report covering all routes to admission as a solicitor, both the SQE and through the old routes under our transitional provisions.
Reasonable adjustments and assistive technology
We are committed to making sure that candidates with disabilities are not unfairly disadvantaged in demonstrating their competence during assessments. Kaplan considers requests for reasonable adjustments to SQE assessment methods on a case-by-case basis for candidates with disabilities (as defined by the Equality Act 2010). Kaplan also considers requests for adjustments from candidates if they do not have a disability as defined by the Equality Act to accommodate candidates with other conditions which impact on their ability to demonstrate their competence.
Between September 2021 and July 2023, Kaplan implemented more than 1,000 reasonable adjustment plans. The pass rates for candidates who have reasonable adjustment plans are similar to those for the full cohort in all SQE assessments. There is no consistent pattern to suggest that candidates with reasonable adjustments achieved higher or lower pass rates than those without.
Our Reasonable Adjustments Policy and dedicated website information outlines our approach to reasonable adjustments in more detail, including the arrangements we frequently make and how we communicate with candidates. Kaplan updated this policy in January 2024 to include the following changes:
- Clarification on how the policy applies to accommodations for those that are not disabled within the meaning of the Equality Act 2010 but have conditions which impact on their ability to undertake the SQE.
- Further information to assist candidates about what should be included in the reasonable adjustments request form.
- Confirmation that a specific member of the Equality & Quality team will be appointed as the candidate's reasonable adjustment liaison (RAL) and more information on the role of the RAL. This is the candidate's main point of contact and reflects our previous practice.
A growing range of assistive technologies have been used, or are available for use, by candidates with disabilities taking the SQE. These technologies include scanning pens, speech recognition software (Dragon), and mini microphones used by oral assessors during interviews and advocacy assessments. The software package Fusion is also available, which includes the screen reader JAWS, allowing for speech tracking while navigating items on the screen, and the option to use a refreshable braille display.
SQE in Welsh
England and Wales is a single legal jurisdiction comprising two nations and two official languages. We support access to legal services in both official languages, and we have committed to offering the SQE in Welsh. Candidates can already choose to take SQE2 in Welsh. From September 2024, SQE1 will also be available in Welsh.
In September 2021, ahead of the introduction of the SQE2 in Welsh, we ran a pilot with fluent Welsh speakers to explore the practicalities of running the assessment in Welsh. We used the findings to inform both our final approach and the development of SQE2 in Welsh. Similarly, in June 2023, we ran a pilot for SQE1 in Welsh . The findings from this pilot are informing our approach to delivering SQE1 in Welsh.
Kaplan has recruited a panel of Welsh-speaking solicitors to support the development and delivery of the SQE in Welsh. In addition, Kaplan now also employs two in-house professional Welsh translators who are members of the Cymdeithas Cyfieithwyr Cymru, the professional association for English to/from Welsh translators and interpreters.
We have been working with Canolfan Bedwyr – Bangor University's Centre for Welsh Language Services, Research and Technology – as we develop our approach to translation. Given the complexities around the availability of comparable legal terms in Welsh, any particularly challenging terms in Welsh will be referred to Canolfan Bedwyr. Its experts in legal terminology and Welsh language matters will then conduct further research and confirm or make suggestions as to the term to be used.
We want to make sure that Welsh-speaking aspiring solicitors can make informed choices about which language to sit the SQE assessment in. Therefore we are working on providing helpful information, including knowing what to expect in the exam and what resources will be used. The pilots we have undertaken continue to inform our approach in this area. This is alongside ongoing discussions with Welsh universities and other Welsh stakeholders, including the Welsh Government's legislative translation unit.
In early 2024, we will undertake focus groups with Welsh-speaking students to further develop our understanding. We are also working with Coleg Cymraeg Cenedlaethol, Welsh universities and the Law Council Education and Training sub-committee. This is with regards to the issue of SQE preparatory courses in Welsh and the promotion of our SQE Welsh language offer.
In April 2023, in recognition of several diverging areas of law in Wales and England, we published updated versions in English of the SQE1 and SQE2 Assessment Specifications. These make clear our expectations around understanding the laws in England and Wales, how they apply and where they differ. For instance, for Property Practice, candidates need to understand differences in relation to taxation specifically Stamp Duty Land Tax in England and Land Transaction Tax in Wales. We engaged with the Education and Training Committee of the Law Council of Wales and SQE training providers as we developed these changes.
We have undertaken wide-ranging engagement with stakeholders in Wales to discuss the SQE. For example, we have met with local law societies and representatives from the legal sector in Wales. We continue to hold regular meetings with the Law Society in Wales and the Welsh Government. We have also met with Qualifications Wales to understand how other bilingual examinations work in Wales.
The SQE has the potential to improve access to qualifying as a solicitor by removing unjustifiable barriers to entry, such as the previous requirement for a period of recognised training lasting at least two years.
Under the SQE, candidates have a lot of flexibility to select training and work experience options best suited to their financial and lifestyle needs. This could benefit aspiring solicitors from a diverse range of backgrounds.
We are committed to maximising the potential benefits of the SQE for increasing access to qualifying as a solicitor. To that end, we committed to the following actions in the 2020 EDI Risk Assessment for the SQE:
- informing candidates of their full results to aid fair recruitment and help candidates market themselves if they followed a less traditional route to qualification
- adding to our resources that explain the new routes to qualification and tailoring these to the needs of different stakeholder groups
- engaging with training providers to help them understand the benefits of the new system and the role that they can play in creating a competitive and healthy market for SQE training.
We provide updates on each of these commitments below.
Informing candidates of their full results
For each SQE assessment, we provide candidates with the pass mark and their own score, expressed as a scaled score for SQE1 and a percentage for SQE2. We also provide the candidate's quintile score to show where their score stands in comparison to all those who took the assessment at the same time. We offer information to help candidates understand their SQE1 results and their SQE2 results in detail.
Starting in January 2024, candidates receive a breakdown of their marks by practice area for SQE1. This will help them to identify any gaps in their knowledge and plan their future training effectively. Candidates also receive a full breakdown by assessment stations for SQE2.
In January 2024, we moved to week long assessment windows for each of FLK1 and FLK2, improving test centre availability and giving candidates greater flexibility when sitting the exam.
Due to this change, there are now different FLK1 and FLK2 papers in each assessment window. We therefore introduced a system of scaled scoring to enable us to present results in a way that would allow for accurate and fair comparisons between candidates. This means candidate scores can be directly compared, even if they took different papers.
Scaled scoring will enable us to make more accurate comparisons of candidate performance at SQE1 over time and across different sittings. We have provided more information on our website and via a webinar to help candidates understand scaled scoring . We will consider whether a similar approach would be helpful for SQE2.
Our resources explaining the new routes to qualification
We have improved our resources for aspiring solicitors and SQE candidates to include more detailed information, including:
- an overview of all the training options , including sample pathways and funding options
- information on solicitor apprenticeships , including a video to help aspiring solicitors decide if an apprenticeship is for them
- a list of providers of SQE preparatory training and SQE study materials
- a guide to registering for SQE assessments , including information on reasonable adjustments
- QWE information for both SQE candidates and employers
- tailored information for individuals who come within our transitional provisions , and for qualified lawyers looking to qualify as a solicitor
- a Q&A for aspiring solicitors and candidates on the SQE.
We have also supported The Law Society to provide information for aspiring solicitors on a range of topics, including:
- preparatory courses and sources of funding
- information for international students and lawyers
- the SQE in Welsh
- solicitor apprenticeships.
Our engagement with training providers
We have held regular meetings with organisations that provide preparatory training for the SQE assessments. These meetings included:
- face-to-face roundtable discussions held between May and November 2022 in Birmingham, Leeds, London, Manchester and Swansea
- a virtual conference in March 2023
- several other virtual meetings.
During these, we discussed various topics in detail with the training providers, including:
- the most recent SQE Independent Reviewer report and Kaplan's annual SQE report
- what we've learnt so far about supporting SQE candidates, including performance by practice area and use of the SQE sample questions
- an update on QWE
- proposals to publish SQE data on candidate performance
- a review of the SQE1 assessment specification , including our expectations of candidates regarding Welsh law
- changes to the timing of SQE1 results
- changes to SQE1 delivery from January 2024.
We have recently published more sample SQE questions in response to feedback from candidates and training providers. We also talk regularly to training providers to help with capacity planning for future SQE assessments, including regular detailed capacity planning surveys which we ask training providers to complete.
Under the old system, qualifying as a solicitor was often an expensive process, disadvantaging less affluent students. The Legal Practice Course (LPC) alone can cost up to £16,750. In our 2020 EDI Risk Assessment for the SQE, we anticipated that the SQE could help to reduce this cost for some candidates. We suggested that by removing the requirement for a specific course, the SQE could promote the emergence of different training products at a wider range of price points.
It's too soon to draw definitive conclusions about the impact of the SQE on the legal education and training market. However, there are early indications that the assessment has had a positive effect on the range of options available and the cost of qualifying.
In February 2023, we published information on the developing SQE training market. It showed that the range of SQE preparation courses that did not lead to an academic award were mostly within the price range of £500 - £4,500. For those leading to an academic award at a degree or postgraduate level, they were within the price range of £7,500 - £13,000.
For many of these options, the combined cost of training and the SQE exams are below those for the LPC under the former system. Several training providers also allow candidates to spread the cost of their SQE preparation courses over instalments. We published new data on training costs and options as part of our SQE training provider list in March 2024 and will explore this issue further in our three-year evaluation starting in autumn 2024.
Informing candidate choice
As part of the 2020 EDI risk assessment, we committed to publishing resources to help candidates navigate the range of training options available. To that end, we updated our resources to help aspiring solicitors when considering a training provider in October 2023. The resources outline the types of questions or information an aspiring solicitor may want to consider or obtain when choosing a provider.
Our SQE training provider list has been updated to better help aspiring solicitors understand the range of SQE preparation courses available. We have included more information including cost, length of course, how the course is delivered and who it is aimed at. During 2024, we will continue to engage with aspiring solicitors and organisations to highlight our resources and learn how we can further inform candidate choice.
We remain committed to publishing further data to help potential SQE candidates decide how best to prepare for the assessments. This includes linking candidate outcomes with the training they told us they had undertaken.
By publishing this data, we will support the wider objectives of the SQE. It will help aspiring solicitors to navigate the training options available and identify the best options for them individually. It will address some of the issues raised by the Bridge Group in their March 2017 report , who said publishing this data could help stakeholders monitor diversity and drive positive action within the profession.
Data on candidate performance by provider should also incentivise providers to deliver good quality preparatory courses. And we want to support a market which provides a range of choices for candidates.
Our intention is to break the data down by specific courses or types of courses where we have sufficient data to do so. And to encourage users of the data to take the range of courses and information about them into account when using it. We also intend to make the data available in a way that enables users to view candidate performance by providers by multiple data categories.
The SQE training market is rapidly developing with many providers offering more than one course. It is important that any data we publish about candidate performance by provider covers the wide range of training courses available. And that candidate performance is appropriately contextualised, where possible.
For example, some courses may have very high pass rates. But it may be that a provider has imposed entry requirements so that only those most likely to pass are able to take those courses. And other courses might have lower pass rates, but the pass rates might be much higher than one might expect from the prior attainment of those taking those courses. Also, if a small number of candidates have taken a specific course, publishing performance data for that course could inadvertently identify a candidate or a small group of candidates.
We are mindful of these challenges and any unintended consequences on choice and the SQE training market. At present, we do not have enough data to publish information that could be helpful, given the wide range of training options available. However, the number of candidates taking the SQE is increasing significantly, especially for SQE1, which means that our data bank will grow over time. We plan to review the data after each sitting in 2024 to determine whether it is large enough to inform a useful publication.
We also continue to explore the types of data we could publish to best contextualise candidate performance and to help aspiring solicitors engage with the data.
As we develop our approach, we will continue to engage with training providers and aspiring solicitors. We will also explore alternative ways we can support candidates identify the options that might suit them best.
We will make granular data available to approved researchers for further analysis which may increase further understanding of the causes of disparities in candidate performance.
Solicitor apprenticeships
Aspiring solicitors in England can qualify through a solicitor apprenticeship. This provides a cost-effective alternative to the traditional qualification route through university and may suit candidates who want to 'earn as they learn'. Costs of training and assessments are paid for through the apprenticeship levy fund, so there is no cost to candidates. Some employers also offer solicitor apprenticeships to individuals who have already completed some training, for example a degree. We provided a webinar to help aspiring solicitors decide if an apprenticeship is for them .
The solicitor apprenticeship has proven to be a popular and successful way to qualify. Data from the Institute for Apprenticeships and Technical Education shows that the number of individuals commencing solicitor apprenticeships has grown rapidly. Here are the number of people who have started on a solicitor apprenticeship:
- 222 in 2020/21
- 584 in 2021/22
- 777 in 2022/23
By July 2023, this brings the total number of solicitor apprentices on the path to qualification to 2,132.
Between October 2022 and July 2023, nearly 400 solicitor apprentices sat SQE assessments, out of around 8,000 candidates. Apprentices have performed well on the SQE, with higher-than-average pass rates for both SQE1 and SQE2. This indicates that the experience and learning on the apprenticeship route is often good preparation for the SQE assessments.
Quality of training during qualifying work experience
Under the SQE, aspiring solicitors must complete two years of full-time (or equivalent) QWE to qualify. Candidates can complete their QWE in up to four organisations that provide legal services, whether or not we regulate them. Previously, aspiring solicitors had to complete a two-year period of recognised training (PRT) in an organisation we authorised to provide the training. A PRT is often known as a training contract. We introduced QWE in part to remove unjustifiable barriers to qualifying as a solicitor and to give more opportunities to gain legal work experience that would count towards qualification.
During the SQE's development, concerns were raised that introducing QWE could lead to irresponsible employers hiring candidates without providing appropriate training or exploiting them by making them work without pay. To understand whether these concerns have materialised, we have committed to gathering evidence on the experiences of candidates and organisations with QWE on an annual basis.
In November 2022, we conducted an initial survey to gather information about perceptions and experiences of the SQE and QWE. We published a report on the survey findings in March 2023. The following year, we conducted our second annual survey, asking the same QWE questions as the initial survey conducted. Notable results of this second survey included:
- Nearly 90% of candidates were very satisfied or satisfied with the supervision during their QWE, a 5 percentage point increase from the initial survey.
- More than 90% of candidates agreed or strongly agreed that their QWE had helped them develop the competences they need to practise effectively as a solicitor.
- Ninety-three percent of candidates said that they were exposed to a broad range of competences during their QWE, a 14 percentage point increase from the initial survey.
We also asked candidates about their use of the QWE training template that we provide, and over half of the respondents said they had used it. Of those, more than 80% found the template to be helpful or very helpful.
We published a full report on this latest survey in April 2024 .
We have also developed resources to assist candidates who are seeking QWE. Our web resources include questions and answers for both candidates and paralegal staff who want to know if their current work can count as QWE. We have worked with The Law Society to support its resources on QWE, such as their blog and short videos for those seeking QWE .
We offer guidance and support to candidates if an employer refuses to confirm their QWE, including through our helpline. We have also published guidance to support employers and guidance on our expectations for firms on providing good QWE .
Since March 2021, we have continued to engage with key stakeholders and representative groups through events, webinars, conferences and our website. We have produced 33 videos on the SQE and QWE, which have received approximately 56,700 views in total. We have hosted virtual SQE conferences since 2020.
In 2023, the conference topics included how to support SQE candidates, confirming QWE and using SQE sample questions. To date, the 2023 virtual conference has received roughly 6,000 on-demand views. We ran the latest virtual SQE conference in March 2024.
We have a regular SQE market stall at both our annual Compliance Officers Conference and at LegalEx, the UK's largest free-to-attend legal event, where we answer questions from aspiring solicitors and other interested individuals. We regularly publish a dedicated SQE Update bulletin, which now has approximately 5,300 email subscribers. Since March 2021, we have published 26 of these bulletins to provide updates on the latest SQE news. Online, we have had more than 1.4 million visits to our SQE-related web pages.
On social media, our SQE-related posts have received approximately 84,000 engagements and 2.2 million impressions since March 2021. Our SQE LinkedIn group has more than 4,700 members, providing stakeholders with updates on the latest news about the SQE and QWE and the opportunity to ask us questions directly.
We also run the Career in Law Facebook and Instagram pages, which have a combined total of more than 5,600 followers across both platforms. This provides tailored information to aspiring solicitors about the SQE exams and qualifying. As part of our social media engagement strategy, we have run dedicated campaigns on the following:
- the SQE training market
- SQE exam dates and booking information
- SQE resources and information, including assessment specifications and sample questions
- recording QWE
- our degree validation process.
We will continue to work to meet our EDI commitments for the SQE and QWE. This year, we will commission an initial independent evaluation of the SQE, which will provide an opportunity to get some early insights into some of the equality impacts of our reforms.
As part of this evaluation, we will assess the market consequences of the SQE and QWE, including their effects on the cost of training and qualification. We will also continue to collect evidence on perceptions and experiences of QWE on an annual basis.
In spring 2024, University of Exeter will publish the final report of its research on differences in outcomes for ethnic groups in legal professional assessments. This will help us better understand the factors that contribute to disparities in candidate performance by ethnicity. And we will identify and take forward any actions we can take in relation to the SQE to reduce them.
We will continue to monitor performance in the SQE by protected characteristics on an ongoing basis to check for patterns of differential performance. Work is also ongoing to introduce further assistive technologies for candidates with disabilities in 2024.
We are committed to ensuring that the SQE is a fair assessment for all candidates. Therefore, we will continue to review the EDI impacts of our reforms on an ongoing basis and engage with representative groups and other key stakeholders working in this area.
IMAGES
VIDEO
COMMENTS
Giving Progress Updates. A large part of scientific communication involves progress updates between you and your mentors, whether they be within your research lab, your PI or your graduate student/post-doc. These typically will occur weekly (sometimes less frequently depending on your lab dynamics) and may take on many different forms.
There are three types of RPPRs, all of which use the NIH RPPR Instruction Guide. Annual RPPR - Use to describe a grant's scientific progress, identify significant changes, report on personnel, and describe plans for the subsequent budget period or year. Final RPPR - Use as part of the grant closeout process to submit project outcomes in ...
November 8, 2022. Alzheimer's Disease. NIH has released Advancing Alzheimer's Disease and Related Dementias Research for All Populations: Prevent. Diagnose. Treat. Care. (PDF, 17M), a 2022 scientific progress report. The report features science advances and related efforts made between March 2021 and early 2022 in areas including drug ...
Information and resources on how to submit the three variations of the Research Performance Progress Report can found on this page. All progress reports for NIH grants must be submitted electronically using the Research Performance Progress Report (RPPR) module in eRA Commons (See OER's RPPR webpage for details). Progress reports document the recipient's accomplishments and compliance with ...
End your progress report by summarizing the current status of the project, good news, and key problems. State again whether the project will be completed on time and on budget. Like e-mail ...
Stay updated with the latest science news, discoveries, and analysis from Nature, the world's leading research journal.
NIH has released Advancing Alzheimer's Disease and Related Dementias Research for All Populations: Prevent.Diagnose. Treat. Care (PDF, 17.5M), a 2022 scientific progress report. This report provides a comprehensive overview of the meaningful progress researchers made from April 2021 through March 2022 to address the enormous challenges of Alzheimer's and related dementia diseases.
Doing so will help keep your research on track and lay the groundwork for a future renewal application. In certain circumstances, your program officer can work with you to help overcome science-driven obstacles. For additional instruction and resources, refer to NIAID's Research Performance Progress Report (RPPR) SOP.
Writing a progress/status report by Michael Ernst January, 2010. Writing a weekly report about your research progress can make your research more successful, less frustrating, and more visible to others, among other benefits. One good format is to write your report in four parts: Quote the previous week's plan. This helps you determine whether ...
NIH has released Advancing Alzheimer's Disease and Related Dementias Research for All Populations: Prevent. Diagnose. Treat. Care. (PDF, 17M), a 2022 scientific progress report. The report features science advances and related efforts made between March 2021 and early 2022 in areas including drug development, lifestyle interventions ...
The results give insight into how hair and tissues age, and how some diseases associated with aging may arise. 2021 Research Highlights — Human Health Advances >>. Noteworthy NIH advances in basic research include progress in understanding SARS-CoV-2, new approaches to developing antibiotics, and the discovery of a brain receptor linked to ...
Systematic reviews synthesise relevant research around a particular question. Preparing a systematic review is time and resource consuming, and provides a snapshot of knowledge at the time of incorporation of data from studies identified during the latest search. Newly identified studies can change the conclusion of a review.
Progress update. Your activity summary and progress updates might sound similar, but activities are usually more task-oriented while progress is usually either an outcome or progress toward a specific outcome. For example, let's say that your progress update outlines that your engineering team spent time writing code for a new feature this week.
Progress in Cancer Research. Basic, molecular, epidemiologic, and clinical research are leading to improved cancer prevention, screening, and treatment. Decreasing cancer mortality death rates and increasing numbers of cancer survivors are important indicators of the progress we have made. As the leader of the National Cancer Program, NCI has ...
1. Think of it as a Q&A. Before you start worrying about your reporting frequency and whether you should provide monthly reports or weekly reports, take a step back and focus on the purpose of the report itself. In essence, the reporting process comes down to Q&A; you're answering key questions about your progress.
Let's explore the four most common types of status reports and their unique benefits. 1. Daily status reports. Daily status reports provide a granular view of a project's progress, ideal for fast-paced projects or those nearing critical milestones. These concise updates typically include: Tasks completed today.
1. Present early and often. Better to reconsider your design before submitting the IRB, collecting data, or writing the manuscript. 2. Present weeks or months before key deadlines. You'll be more willing to incorporate major changes and have time to present again. 3. Invite faculty. Ask your mentor (s) to come.
Here are some tips that will get you started with your research progress report. 1. Write the Title of Your Report. The title of your report should at least be about what your research is about. It does not have to be something too fancy that the whole point of the report is lost or too obvious that would make the report redundant. 2.
A progress report is a business document that provides updates on a project's progress toward meeting a goal. Typically, you'll provide a progress report for a supervisor/manager, team member, or business client to summarize a project's status and what still needs to be completed or improved. ... August 30 - Research completed into ...
Progress across the continuum of cancer research and patient care improves survival and quality of life for people around the world. In the United States, the annual decline in overall cancer death rate among men, women, children, and adolescents and young adults has accelerated over the past two decades (see Cancer in 2023) () Cronin KA, et al. (2022) Cancer, 128: 4251.
What is a Progress Report Template? A progress report template is a pre-built form, page, or checklist to consistently provide detailed project documentation in a timely manner. These resources can be tailored to fit the specific needs of your project or team processes, and are generally kept by the project managers to share with members and stakeholders on a weekly or monthly basis.
Here, we quantify relative progress in research topics of a nation from the time-series comparison of reference lists from papers, using 71 million published papers from Scopus.
This is an update on the progress we've made towards fulfilling our commitments in the SQE Equality, Diversity and Inclusion Risk Assessment, published in July 2020. ... The research will use interviews and surveys to examine the lived experiences of aspiring solicitors and past candidates. The final report will be published in spring 2024.